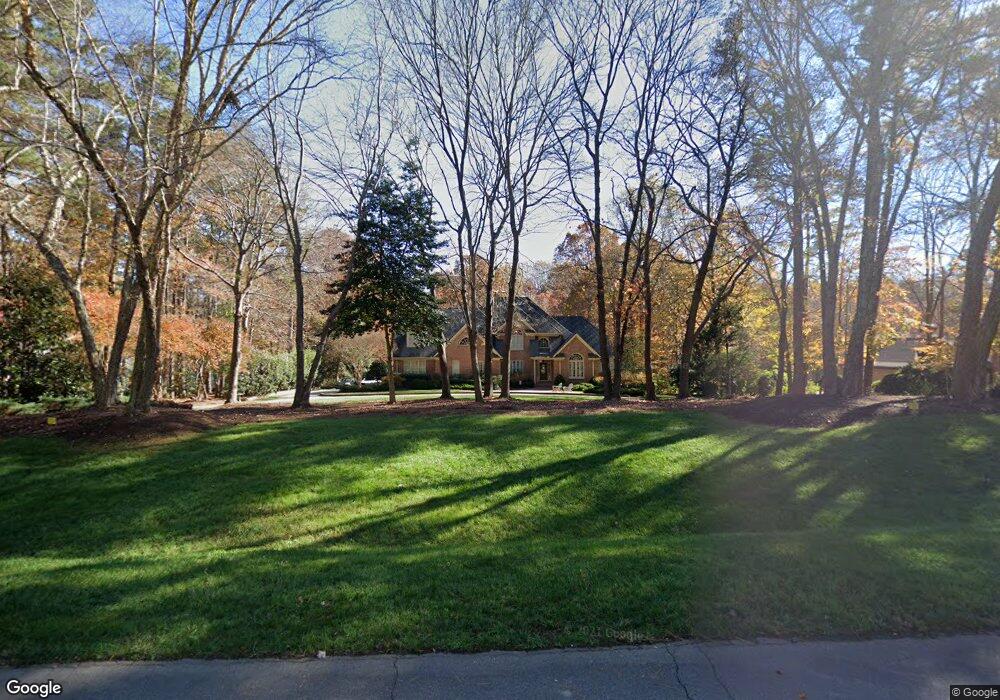
9816 Koupela Dr Raleigh, NC 27614
Falls Lake NeighborhoodEstimated Value: $1,207,000 - $1,446,789
5
Beds
4
Baths
4,594
Sq Ft
$295/Sq Ft
Est. Value
About This Home
This home is located at 9816 Koupela Dr, Raleigh, NC 27614 and is currently estimated at $1,355,947, approximately $295 per square foot. 9816 Koupela Dr is a home located in Wake County with nearby schools including Brassfield Elementary School, West Millbrook Middle School, and Millbrook High School.
Ownership History
Date
Name
Owned For
Owner Type
Purchase Details
Closed on
Oct 3, 2018
Sold by
Bailey Paul G and Frutuozo Haidelsio Jose
Bought by
Marks Peter V and Marks Theresa C
Current Estimated Value
Home Financials for this Owner
Home Financials are based on the most recent Mortgage that was taken out on this home.
Original Mortgage
$694,525
Outstanding Balance
$605,667
Interest Rate
4.5%
Mortgage Type
VA
Estimated Equity
$750,280
Purchase Details
Closed on
Dec 15, 2010
Sold by
Jpmorgan Chase Bank National Association
Bought by
Bailey Paul G
Home Financials for this Owner
Home Financials are based on the most recent Mortgage that was taken out on this home.
Original Mortgage
$417,000
Interest Rate
4.32%
Mortgage Type
New Conventional
Purchase Details
Closed on
Aug 25, 2010
Sold by
Frohman David R and Frohman Janice R
Bought by
Jpmorgan Chase Bank National Association
Create a Home Valuation Report for This Property
The Home Valuation Report is an in-depth analysis detailing your home's value as well as a comparison with similar homes in the area
Home Values in the Area
Average Home Value in this Area
Purchase History
| Date | Buyer | Sale Price | Title Company |
|---|---|---|---|
| Marks Peter V | $775,000 | None Available | |
| Bailey Paul G | $522,500 | None Available | |
| Jpmorgan Chase Bank National Association | $446,551 | None Available |
Source: Public Records
Mortgage History
| Date | Status | Borrower | Loan Amount |
|---|---|---|---|
| Open | Marks Peter V | $694,525 | |
| Previous Owner | Bailey Paul G | $417,000 |
Source: Public Records
Tax History Compared to Growth
Tax History
| Year | Tax Paid | Tax Assessment Tax Assessment Total Assessment is a certain percentage of the fair market value that is determined by local assessors to be the total taxable value of land and additions on the property. | Land | Improvement |
|---|---|---|---|---|
| 2025 | $6,569 | $1,023,903 | $360,000 | $663,903 |
| 2024 | $6,378 | $1,023,903 | $360,000 | $663,903 |
| 2023 | $6,493 | $830,151 | $170,000 | $660,151 |
| 2022 | $6,015 | $830,151 | $170,000 | $660,151 |
| 2021 | $5,853 | $830,151 | $170,000 | $660,151 |
| 2020 | $5,756 | $830,151 | $170,000 | $660,151 |
| 2019 | $6,676 | $814,980 | $150,000 | $664,980 |
| 2018 | $6,059 | $804,759 | $150,000 | $654,759 |
| 2017 | $5,742 | $804,759 | $150,000 | $654,759 |
| 2016 | $5,625 | $804,759 | $150,000 | $654,759 |
| 2015 | $5,657 | $811,702 | $155,000 | $656,702 |
| 2014 | $5,361 | $811,702 | $155,000 | $656,702 |
Source: Public Records
Map
Nearby Homes
- 4817 Fox Branch Ct
- 4708 Wynneford Way
- 9925 Koupela Dr
- 11705 Durant Rd
- 9801 Honeycutt Rd
- 9509 Greenfield Dr
- 4900 Foxridge Dr
- 10708 Trappers Creek Dr
- 10441 Blue Dun Way
- 10545 Pleasant Branch Dr Unit 101
- 10553 Pleasant Branch Dr Unit 201
- 10553 Pleasant Branch Dr Unit 101
- 10551 Pleasant Branch Dr Unit 201
- 10551 Pleasant Branch Dr Unit 101
- 10549 Pleasant Branch Dr Unit 201
- 10549 Pleasant Branch Dr Unit 101
- 10547 Pleasant Branch Dr Unit 201
- 10543 Pleasant Branch Dr Unit 201
- 10543 Pleasant Branch Dr Unit 101
- 10537 Pleasant Branch Dr Unit 201
- 9824 Koupela Dr
- 9812 Koupela Dr
- 9828 Koupela Dr
- 9808 Koupela Dr
- 9817 Koupela Dr
- 9813 Koupela Dr
- 9809 Pentland Ct
- 9825 Koupela Dr
- 4813 Fox Branch Ct
- 9832 Koupela Dr
- 9829 Koupela Dr
- 9804 Koupela Dr
- 9805 Pentland Ct
- 4821 Fox Branch Ct
- 9836 Koupela Dr
- 4809 Fox Branch Ct
- 4816 Fox Branch Ct
- 9801 Pentland Ct
- 9800 Koupela Dr
- 1317 King Cross Ct