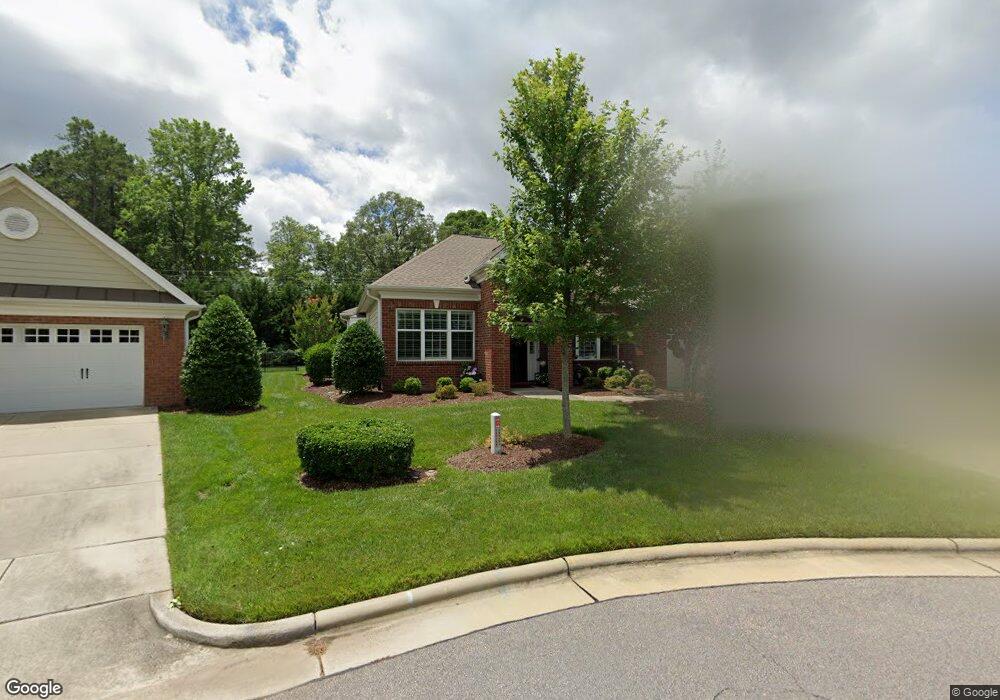
9817 Crooked Tree Ln Raleigh, NC 27617
Estimated Value: $597,704 - $675,000
2
Beds
2
Baths
2,020
Sq Ft
$308/Sq Ft
Est. Value
About This Home
This home is located at 9817 Crooked Tree Ln, Raleigh, NC 27617 and is currently estimated at $622,426, approximately $308 per square foot. 9817 Crooked Tree Ln is a home located in Durham County with nearby schools including Parkwood Elementary, Lowe's Grove Middle, and Hillside High School.
Ownership History
Date
Name
Owned For
Owner Type
Purchase Details
Closed on
Jun 19, 2020
Sold by
Summers John J and Summers Kim S
Bought by
Alsip Mark H and Alsip Mary J
Current Estimated Value
Purchase Details
Closed on
Jun 15, 2020
Sold by
The Summers Family Truist
Bought by
Summers John J and Summers Kim S
Purchase Details
Closed on
Sep 19, 2013
Sold by
Mangam Mitchell W and Mangam Joann W
Bought by
The Summers Family Trust
Home Financials for this Owner
Home Financials are based on the most recent Mortgage that was taken out on this home.
Original Mortgage
$268,500
Interest Rate
4.57%
Mortgage Type
New Conventional
Purchase Details
Closed on
Sep 27, 2010
Sold by
Toll Nc L P
Bought by
Mangum Mitchell W and Mangum Joann W
Home Financials for this Owner
Home Financials are based on the most recent Mortgage that was taken out on this home.
Original Mortgage
$262,295
Interest Rate
4.36%
Mortgage Type
New Conventional
Create a Home Valuation Report for This Property
The Home Valuation Report is an in-depth analysis detailing your home's value as well as a comparison with similar homes in the area
Home Values in the Area
Average Home Value in this Area
Purchase History
| Date | Buyer | Sale Price | Title Company |
|---|---|---|---|
| Alsip Mark H | $405,000 | None Available | |
| Summers John J | $308,000 | None Available | |
| The Summers Family Trust | $358,000 | None Available | |
| Mangum Mitchell W | $350,000 | None Available |
Source: Public Records
Mortgage History
| Date | Status | Borrower | Loan Amount |
|---|---|---|---|
| Previous Owner | The Summers Family Trust | $268,500 | |
| Previous Owner | Mangum Mitchell W | $262,295 |
Source: Public Records
Tax History Compared to Growth
Tax History
| Year | Tax Paid | Tax Assessment Tax Assessment Total Assessment is a certain percentage of the fair market value that is determined by local assessors to be the total taxable value of land and additions on the property. | Land | Improvement |
|---|---|---|---|---|
| 2025 | $5,650 | $621,436 | $131,250 | $490,186 |
| 2024 | $4,613 | $399,836 | $93,525 | $306,311 |
| 2023 | $4,739 | $399,836 | $93,525 | $306,311 |
| 2022 | $4,459 | $399,836 | $93,525 | $306,311 |
| 2021 | $4,379 | $399,836 | $93,525 | $306,311 |
| 2020 | $4,268 | $399,836 | $93,525 | $306,311 |
| 2019 | $4,600 | $399,836 | $93,525 | $306,311 |
| 2018 | $4,512 | $371,013 | $74,820 | $296,193 |
| 2017 | $4,427 | $371,013 | $74,820 | $296,193 |
| 2016 | $4,299 | $371,013 | $74,820 | $296,193 |
| 2015 | $3,907 | $321,816 | $64,218 | $257,598 |
| 2014 | $3,852 | $321,816 | $64,218 | $257,598 |
Source: Public Records
Map
Nearby Homes
- 11137 Bayberry Hills Dr
- 3102 Globe Rd
- 11213 Emerald Creek Dr
- 9805 Carlyle Hills Way
- 9441 Collingdale Way
- 11548 Helmond Way Unit 104
- 11548 Helmond Way Unit 115
- Coleman Plan at Tanglewood - Ardmore Collection
- 11549 Helmond Way Unit 107
- 9821 Castain Dr
- 9819 Castain Dr
- 6007 Shade Tree Ln
- 11552 Auldbury Way
- 1006 Sycaten St
- 9909 Grettle Ct
- 1032 Brightskies St
- 1016 Brightskies St
- 1019 Sycaten St
- 1018 Excite Ave
- 1103 Excite Ave
- 9813 Crooked Tree Ln
- 11141 Bayberry Hills Dr
- 11145 Bayberry Hills Dr
- 9809 Crooked Tree Ln
- 9805 Crooked Tree Ln
- 11149 Bayberry Hills Dr
- 11149 Bayberry Hills Dr
- 11144 Bayberry Hills Dr
- 11144 Bayberry Hills Dr
- 11140 Bayberry Hills Dr
- 9801 Crooked Tree Ln
- 11153 Bayberry Hills Dr
- 11136 Bayberry Hills Dr
- 11137 Bayberry Hills Dr
- 11148 Bayberry Hills Dr
- 3011 Page Rd
- 11158 Bayberry Hills Dr
- 11132 Bayberry Hills Dr
- 11157 Bayberry Hills Dr
- 3102 Page Rd