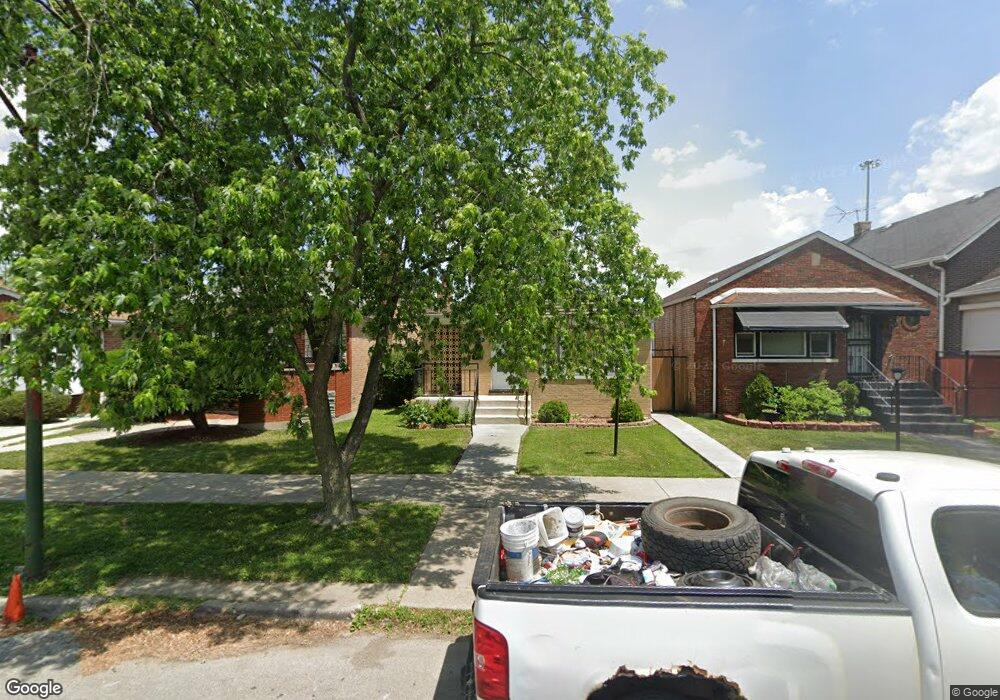
9817 S Harvard Ave Chicago, IL 60628
Roseland NeighborhoodEstimated Value: $185,652 - $228,000
3
Beds
1
Bath
1,200
Sq Ft
$171/Sq Ft
Est. Value
About This Home
This home is located at 9817 S Harvard Ave, Chicago, IL 60628 and is currently estimated at $205,413, approximately $171 per square foot. 9817 S Harvard Ave is a home located in Cook County with nearby schools including Evers Elementary School, Harlan Community Academy High School, and Christian S T E M Scholars.
Ownership History
Date
Name
Owned For
Owner Type
Purchase Details
Closed on
Oct 19, 2018
Sold by
Chicago Title Land Trust Co
Bought by
Pizano Rebecca
Current Estimated Value
Home Financials for this Owner
Home Financials are based on the most recent Mortgage that was taken out on this home.
Original Mortgage
$108,600
Outstanding Balance
$95,107
Interest Rate
4.7%
Mortgage Type
Commercial
Estimated Equity
$110,306
Purchase Details
Closed on
Jul 17, 2006
Sold by
Smith Gloria D
Bought by
Chicago Title & Trust and Trust #8002346936
Purchase Details
Closed on
May 17, 1994
Sold by
Lamb Willie L Taylor and Lamb Charles E
Bought by
Smith Gloria D
Home Financials for this Owner
Home Financials are based on the most recent Mortgage that was taken out on this home.
Original Mortgage
$71,250
Interest Rate
5.25%
Create a Home Valuation Report for This Property
The Home Valuation Report is an in-depth analysis detailing your home's value as well as a comparison with similar homes in the area
Home Values in the Area
Average Home Value in this Area
Purchase History
| Date | Buyer | Sale Price | Title Company |
|---|---|---|---|
| Pizano Rebecca | $54,000 | Advisors Title Network Llc | |
| Chicago Title & Trust | $97,000 | Tristar Title Llc | |
| Smith Gloria D | $75,000 | -- |
Source: Public Records
Mortgage History
| Date | Status | Borrower | Loan Amount |
|---|---|---|---|
| Open | Pizano Rebecca | $108,600 | |
| Previous Owner | Smith Gloria D | $71,250 |
Source: Public Records
Tax History Compared to Growth
Tax History
| Year | Tax Paid | Tax Assessment Tax Assessment Total Assessment is a certain percentage of the fair market value that is determined by local assessors to be the total taxable value of land and additions on the property. | Land | Improvement |
|---|---|---|---|---|
| 2024 | $2,009 | $13,000 | $3,534 | $9,466 |
| 2023 | $1,960 | $9,500 | $2,790 | $6,710 |
| 2022 | $1,960 | $9,500 | $2,790 | $6,710 |
| 2021 | $1,552 | $9,500 | $2,790 | $6,710 |
| 2020 | $2,551 | $11,422 | $2,790 | $8,632 |
| 2019 | $2,528 | $12,552 | $2,790 | $9,762 |
| 2018 | $2,486 | $12,552 | $2,790 | $9,762 |
| 2017 | $2,362 | $10,950 | $2,418 | $8,532 |
| 2016 | $2,198 | $10,950 | $2,418 | $8,532 |
| 2015 | $2,123 | $11,558 | $2,418 | $9,140 |
| 2014 | $1,972 | $10,602 | $2,232 | $8,370 |
| 2013 | $1,933 | $10,602 | $2,232 | $8,370 |
Source: Public Records
Map
Nearby Homes
- 9747 S Harvard Ave
- 422 W 98th Place
- 9638 S Harvard Ave
- 9745 S Wentworth Ave
- 9632 S Yale Ave
- 9630 S Yale Ave
- 445 W 98th St
- 400 W 99th Place
- 9606 S Eggleston Ave
- 520 W 97th St
- 10015 S Princeton Ave
- 10012 S Yale Ave
- 10016 S Yale Ave
- 10001 S Wentworth Ave
- 9930 S Perry Ave
- 10020 S Wentworth Ave
- 9741 S Lowe Ave
- 9647 S Lowe Ave
- 347 W 101st Place
- 9521 S La Salle St
- 9821 S Harvard Ave
- 9815 S Harvard Ave
- 9823 S Harvard Ave
- 9811 S Harvard Ave
- 9807 S Harvard Ave
- 9805 S Harvard Ave
- 9816 S Princeton Ave
- 9812 S Princeton Ave
- 9818 S Princeton Ave
- 9801 S Harvard Ave
- 9810 S Princeton Ave
- 9806 S Princeton Ave
- 9804 S Princeton Ave
- 9800 S Princeton Ave
- 9816 S Harvard Ave
- 9818 S Harvard Ave
- 9814 S Harvard Ave
- 9814 S Harvard Ave
- 9820 S Harvard Ave
- 9810 S Harvard Ave