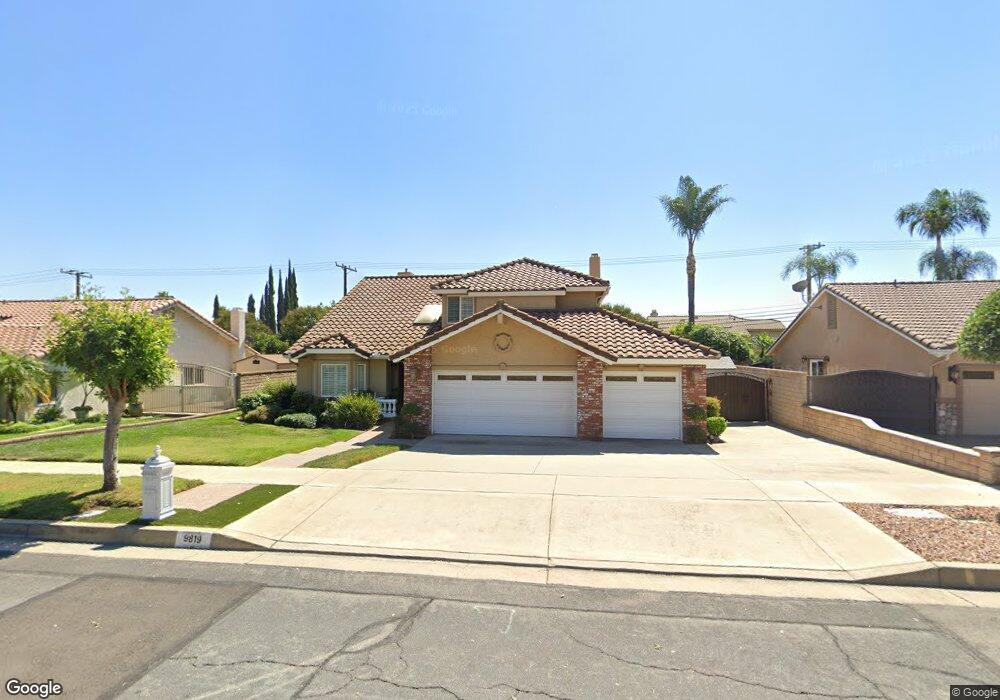
9819 Cypress Ct Rancho Cucamonga, CA 91737
Estimated Value: $833,339 - $972,000
4
Beds
3
Baths
2,009
Sq Ft
$444/Sq Ft
Est. Value
About This Home
This home is located at 9819 Cypress Ct, Rancho Cucamonga, CA 91737 and is currently estimated at $892,835, approximately $444 per square foot. 9819 Cypress Ct is a home located in San Bernardino County with nearby schools including Hermosa Elementary, Vineyard Junior High, and Los Osos High.
Create a Home Valuation Report for This Property
The Home Valuation Report is an in-depth analysis detailing your home's value as well as a comparison with similar homes in the area
Home Values in the Area
Average Home Value in this Area
Tax History Compared to Growth
Tax History
| Year | Tax Paid | Tax Assessment Tax Assessment Total Assessment is a certain percentage of the fair market value that is determined by local assessors to be the total taxable value of land and additions on the property. | Land | Improvement |
|---|---|---|---|---|
| 2025 | $3,360 | $301,348 | $63,729 | $237,619 |
| 2024 | $3,360 | $295,439 | $62,479 | $232,960 |
| 2023 | $3,287 | $289,646 | $61,254 | $228,392 |
| 2022 | $3,277 | $283,967 | $60,053 | $223,914 |
| 2021 | $3,274 | $278,399 | $58,875 | $219,524 |
| 2020 | $3,146 | $275,544 | $58,271 | $217,273 |
| 2019 | $3,178 | $270,141 | $57,128 | $213,013 |
| 2018 | $3,109 | $264,844 | $56,008 | $208,836 |
| 2017 | $2,974 | $259,651 | $54,910 | $204,741 |
| 2016 | $2,896 | $254,559 | $53,833 | $200,726 |
| 2015 | $2,878 | $250,735 | $53,024 | $197,711 |
| 2014 | $2,799 | $245,823 | $51,985 | $193,838 |
Source: Public Records
Map
Nearby Homes
- 6360 Daylily Ct
- 9855 Banyan St
- 9757 Balaton St
- 6155 Klusman Ave
- 10655 401 Lemon Ave Unit 401
- 10141 Orange St
- 9504 Lemon Ave
- 6281 Kinlock Ave
- 10123 Finch Ave
- 6600 Montresor Place
- 9438 La Gloria Dr
- 6055 Amethyst Ave
- 6740 London Ave
- 5885 Zapata Place
- 9979 Timbermist Ct
- 9513 Sunflower St
- 6644 Brissac Place
- 9740 Woodleaf Dr
- 6765 Jadeite Ave
- 10330 Orange St
- 9807 Cypress Ct
- 9827 Cypress Ct
- 9818 Cypress Ct
- 9839 Cypress Ct
- 9804 Cypress Ct
- 6309 London Ave
- 9828 Cypress Ct
- 6320 Calle Elegante
- 6310 Calle Elegante
- 9836 Cypress Ct
- 6319 London Ave
- 6319 Calle Elegante
- 9849 Cypress Ct
- 9780 Lemon Ave
- 9817 Hibiscus Ct
- 6330 Calle Elegante
- 9803 Hibiscus Ct
- 9829 Hibiscus Ct
- 9788 Orange Ave
- 6316 London Ave