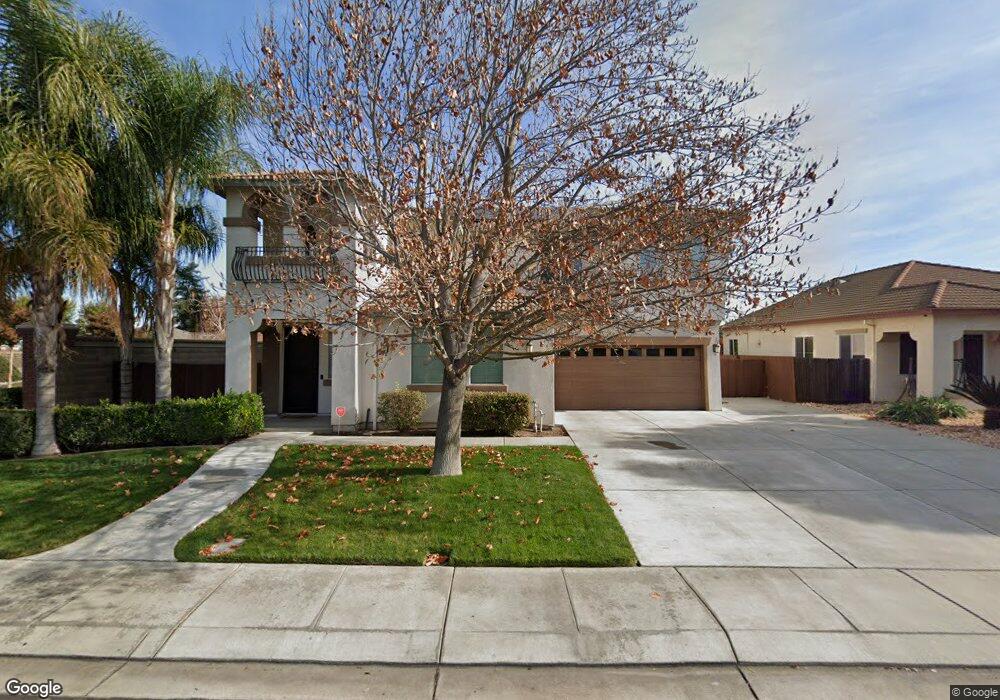
982 Sebastian Ln Manteca, CA 95336
Estimated Value: $629,877 - $727,000
4
Beds
3
Baths
2,639
Sq Ft
$260/Sq Ft
Est. Value
About This Home
This home is located at 982 Sebastian Ln, Manteca, CA 95336 and is currently estimated at $685,219, approximately $259 per square foot. 982 Sebastian Ln is a home located in San Joaquin County with nearby schools including Joshua Cowell Elementary School, Manteca High School, and St. Anthony's Catholic School.
Ownership History
Date
Name
Owned For
Owner Type
Purchase Details
Closed on
Aug 8, 2011
Sold by
Federal Home Loan Mortgage Corporation
Bought by
Geddes Wanda L and Harris Doris L
Current Estimated Value
Home Financials for this Owner
Home Financials are based on the most recent Mortgage that was taken out on this home.
Original Mortgage
$229,042
Outstanding Balance
$157,770
Interest Rate
4.46%
Mortgage Type
FHA
Estimated Equity
$527,449
Purchase Details
Closed on
May 31, 2011
Sold by
Kaur Kuljit and Singh Avtar
Bought by
Federal Home Loan Mortgage Corporation
Purchase Details
Closed on
Aug 16, 2006
Sold by
Western Pacific Housing Inc
Bought by
Singh Avtar and Kaur Kuljit
Home Financials for this Owner
Home Financials are based on the most recent Mortgage that was taken out on this home.
Original Mortgage
$415,948
Interest Rate
6.31%
Mortgage Type
Purchase Money Mortgage
Create a Home Valuation Report for This Property
The Home Valuation Report is an in-depth analysis detailing your home's value as well as a comparison with similar homes in the area
Home Values in the Area
Average Home Value in this Area
Purchase History
| Date | Buyer | Sale Price | Title Company |
|---|---|---|---|
| Geddes Wanda L | $235,000 | Lsi Title Company | |
| Federal Home Loan Mortgage Corporation | $230,000 | Accommodation | |
| Singh Avtar | $438,000 | Chicago Title Co |
Source: Public Records
Mortgage History
| Date | Status | Borrower | Loan Amount |
|---|---|---|---|
| Open | Geddes Wanda L | $229,042 | |
| Previous Owner | Singh Avtar | $415,948 |
Source: Public Records
Tax History Compared to Growth
Tax History
| Year | Tax Paid | Tax Assessment Tax Assessment Total Assessment is a certain percentage of the fair market value that is determined by local assessors to be the total taxable value of land and additions on the property. | Land | Improvement |
|---|---|---|---|---|
| 2025 | $5,033 | $295,162 | $72,848 | $222,314 |
| 2024 | $4,940 | $289,375 | $71,420 | $217,955 |
| 2023 | $4,902 | $283,702 | $70,020 | $213,682 |
| 2022 | $4,854 | $278,141 | $68,648 | $209,493 |
| 2021 | $4,799 | $272,688 | $67,302 | $205,386 |
| 2020 | $4,654 | $269,893 | $66,612 | $203,281 |
| 2019 | $4,596 | $264,602 | $65,306 | $199,296 |
| 2018 | $4,517 | $259,415 | $64,026 | $195,389 |
| 2017 | $4,425 | $254,329 | $62,771 | $191,558 |
| 2016 | $4,388 | $249,342 | $61,540 | $187,802 |
| 2014 | $4,080 | $240,789 | $59,429 | $181,360 |
Source: Public Records
Map
Nearby Homes
- 1003 Alfonso Ln
- 1023 Marsh Creek Ln
- 1015 Lucio St
- 1527 Deerpark Dr
- 938 Buttercup Place
- 1560 Snapdragon Way
- 1129 E Alameda St
- 1073 Spring Meadow Dr
- 1526 Brookside Dr
- 521 Emperor Ct
- Residence 3 Plan at Dawn at The Collective 55+
- 1849 Holly Oak Ct
- 1110 Aldwina Ln
- 338 Cottage Ave
- 1834 Treeline Way
- 1292 Laurel Dr
- 1361 Marceline Dr
- 1786 Brookside Dr
- 743 Larkmont St
- 1931 Diamond Oak Way
- 970 Sebastian Ln
- 958 Sebastian Ln
- 979 Sebastian Ln
- 1014 Sebastian Ln
- 1224 Brookdale Way
- 991 Sebastian Ln
- 1168 Laureto St
- 965 Sebastian Ln
- 944 Sebastian Ln
- 1026 Sebastian Ln
- 1223 Brookdale Way
- 1248 Brookdale Way
- 1160 Laureto St
- 970 Desio Ln
- 932 Sebastian Ln
- 937 Sebastian Ln
- 1249 Brookdale Way
- 1038 Sebastian Ln
- 976 Desio Ln
- 973 Creekside Place