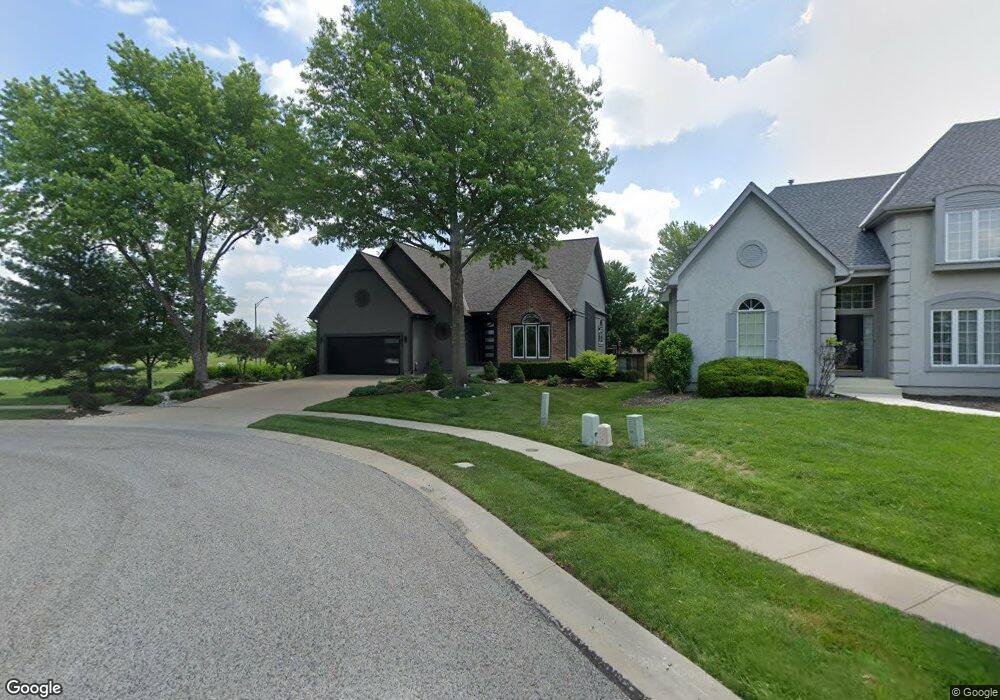
9821 Chestnut St Lenexa, KS 66220
Estimated Value: $467,000 - $567,000
3
Beds
3
Baths
1,656
Sq Ft
$308/Sq Ft
Est. Value
About This Home
This home is located at 9821 Chestnut St, Lenexa, KS 66220 and is currently estimated at $510,516, approximately $308 per square foot. 9821 Chestnut St is a home located in Johnson County with nearby schools including Manchester Park Elementary School, Prairie Trail Middle School, and Olathe Northwest High School.
Ownership History
Date
Name
Owned For
Owner Type
Purchase Details
Closed on
Oct 26, 2020
Sold by
Webber Robert L and Webber Carolyn M
Bought by
Webber Robert L and Webber Carolyn M
Current Estimated Value
Purchase Details
Closed on
Jun 3, 2009
Sold by
Marshall Mary F
Bought by
Webber Robert L and Webber Carolyn M
Home Financials for this Owner
Home Financials are based on the most recent Mortgage that was taken out on this home.
Original Mortgage
$100,000
Interest Rate
4.84%
Mortgage Type
Unknown
Purchase Details
Closed on
Sep 12, 2001
Sold by
Marshall Mary F
Bought by
Marshall Mary F and Mary F Marshall Revocable Trust
Home Financials for this Owner
Home Financials are based on the most recent Mortgage that was taken out on this home.
Original Mortgage
$114,950
Interest Rate
7.07%
Mortgage Type
Balloon
Purchase Details
Closed on
Jul 23, 2001
Sold by
Amundson Lyle R and Amundson Victoria M
Bought by
Marshall Mary F
Home Financials for this Owner
Home Financials are based on the most recent Mortgage that was taken out on this home.
Original Mortgage
$114,950
Interest Rate
7.07%
Mortgage Type
Balloon
Create a Home Valuation Report for This Property
The Home Valuation Report is an in-depth analysis detailing your home's value as well as a comparison with similar homes in the area
Home Values in the Area
Average Home Value in this Area
Purchase History
| Date | Buyer | Sale Price | Title Company |
|---|---|---|---|
| Webber Robert L | -- | None Listed On Document | |
| Webber Robert L | -- | Chicago Title Ins Co | |
| Marshall Mary F | -- | -- | |
| Marshall Mary F | -- | Ati Title Company |
Source: Public Records
Mortgage History
| Date | Status | Borrower | Loan Amount |
|---|---|---|---|
| Previous Owner | Webber Robert L | $100,000 | |
| Previous Owner | Marshall Mary F | $114,950 |
Source: Public Records
Tax History Compared to Growth
Tax History
| Year | Tax Paid | Tax Assessment Tax Assessment Total Assessment is a certain percentage of the fair market value that is determined by local assessors to be the total taxable value of land and additions on the property. | Land | Improvement |
|---|---|---|---|---|
| 2024 | $5,782 | $47,150 | $9,605 | $37,545 |
| 2023 | $5,974 | $47,702 | $9,605 | $38,097 |
| 2022 | $5,723 | $44,563 | $9,153 | $35,410 |
| 2021 | $5,306 | $39,238 | $9,153 | $30,085 |
| 2020 | $5,128 | $37,548 | $9,153 | $28,395 |
| 2019 | $5,176 | $37,628 | $6,986 | $30,642 |
| 2018 | $4,446 | $34,040 | $6,986 | $27,054 |
| 2017 | $4,524 | $31,775 | $6,347 | $25,428 |
| 2016 | $4,250 | $30,510 | $6,041 | $24,469 |
| 2015 | $4,153 | $29,820 | $6,041 | $23,779 |
| 2013 | -- | $27,600 | $6,041 | $21,559 |
Source: Public Records
Map
Nearby Homes
- 9844 Stevenson St
- 9917 Fountain Cir
- 9835 Walker St
- 20516 W 98th Place
- 9517 Falcon Ridge Dr
- 19220 W 98th Terrace
- 0 W 95th St
- 9705 Sunset Cir
- 22003 W 100th Terrace
- 20914 W 96th Terrace
- 20802 W 102nd St
- 18932 W 100th St
- 20825 W 94th Terrace
- 21111 W 95th Terrace
- 21123 W 95th Terrace
- 18804 W 99th St
- 18732 W 99th St
- 20308 W 92nd St
- 9450 Marion St
- 18637 W 97th Terrace
- 9825 Chestnut St
- 19900 W 99th St
- 19906 W 99th St
- 9829 Chestnut St
- 19910 W 99th St
- 9833 Chestnut St
- 9822 Chestnut St
- 9826 Chestnut St
- 19914 W 99th St
- 9830 Chestnut St
- 9834 Chestnut St
- 19920 W 99th St
- 19926 W 99th St
- 19905 W 99th St
- 9823 Vista Dr
- 19901 W 99th St
- 9827 Vista Dr
- 19909 W 99th St
- 9831 Vista Dr
- 9838 Chestnut St