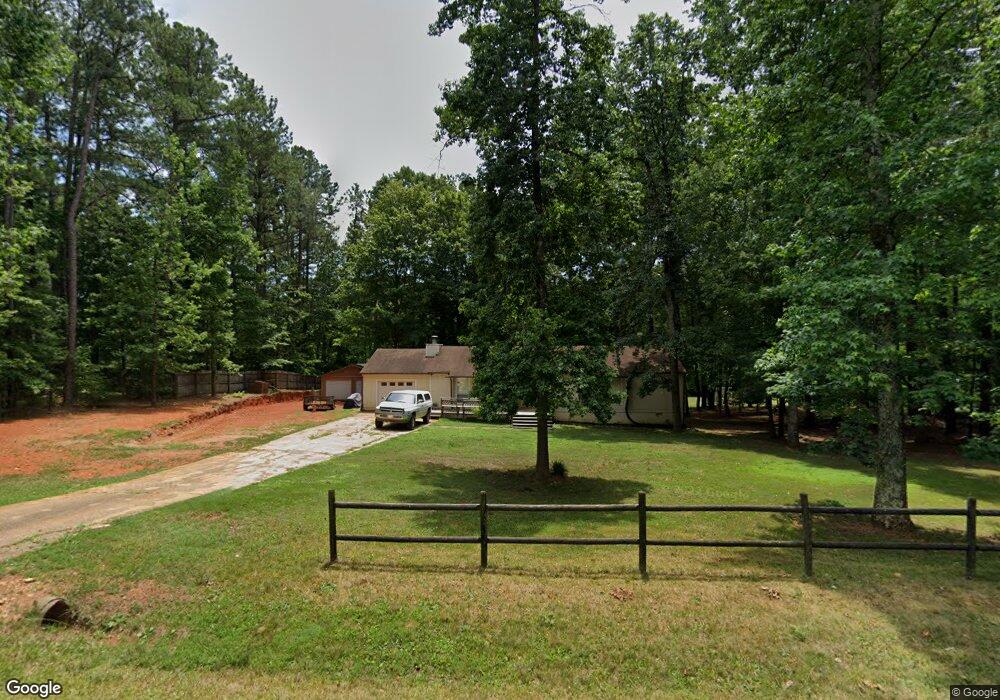
9821 Gralyn Rd Raleigh, NC 27613
Wood Valley NeighborhoodEstimated Value: $436,568 - $501,000
3
Beds
2
Baths
1,553
Sq Ft
$299/Sq Ft
Est. Value
About This Home
This home is located at 9821 Gralyn Rd, Raleigh, NC 27613 and is currently estimated at $464,892, approximately $299 per square foot. 9821 Gralyn Rd is a home located in Wake County with nearby schools including Pine Hollow Middle School, Leesville Road High School, and Quest Academy.
Ownership History
Date
Name
Owned For
Owner Type
Purchase Details
Closed on
Jul 21, 2017
Sold by
Johnson Michael L and Johnson Yvonne M
Bought by
Johnosn Michael L
Current Estimated Value
Purchase Details
Closed on
Feb 21, 2005
Sold by
Hull Robert F and Hull Mary Ann
Bought by
Johnson Michael L and Johnson Yvonne M
Home Financials for this Owner
Home Financials are based on the most recent Mortgage that was taken out on this home.
Original Mortgage
$144,000
Outstanding Balance
$72,470
Interest Rate
5.6%
Mortgage Type
Fannie Mae Freddie Mac
Estimated Equity
$392,422
Purchase Details
Closed on
Jul 18, 2000
Sold by
Ferris Harrison T and Ferris Jana W
Bought by
Hull Robert F
Home Financials for this Owner
Home Financials are based on the most recent Mortgage that was taken out on this home.
Original Mortgage
$126,650
Interest Rate
8.23%
Create a Home Valuation Report for This Property
The Home Valuation Report is an in-depth analysis detailing your home's value as well as a comparison with similar homes in the area
Home Values in the Area
Average Home Value in this Area
Purchase History
| Date | Buyer | Sale Price | Title Company |
|---|---|---|---|
| Johnosn Michael L | -- | None Available | |
| Johnson Michael L | $180,000 | -- | |
| Hull Robert F | $149,000 | -- |
Source: Public Records
Mortgage History
| Date | Status | Borrower | Loan Amount |
|---|---|---|---|
| Open | Johnson Michael L | $144,000 | |
| Previous Owner | Hull Robert F | $126,650 | |
| Closed | Johnson Michael L | $27,000 |
Source: Public Records
Tax History
| Year | Tax Paid | Tax Assessment Tax Assessment Total Assessment is a certain percentage of the fair market value that is determined by local assessors to be the total taxable value of land and additions on the property. | Land | Improvement |
|---|---|---|---|---|
| 2025 | $2,479 | $384,441 | $180,000 | $204,441 |
| 2024 | $2,407 | $384,441 | $180,000 | $204,441 |
Source: Public Records
Map
Nearby Homes
- 9409 Ray Rd
- 10313 Ray Rd
- 5900 Dunzo Dr
- 13022 Edsel Dr
- 13026 Edsel Dr
- 5008 Wood Valley Dr
- 9329 Carlswood Ct
- 9309 Field Maple Ct
- 8901 Braceridge Rd
- 9400 Does Run Ct
- 5902 Dunzo Dr
- 5906 Dunzo Dr
- 13101 Ashford Park Dr
- 5950 Dunzo Dr
- 13357 Ashford Park Dr
- 5020 Red Cedar Rd
- 13227 Ashford Park Dr
- 5962 Dunzo Dr
- 5324 Bartram Place
- 10729 Winding Wood Trail
- 9817 Gralyn Rd
- 9825 Gralyn Rd
- 9800 Chambersbury Rd
- 9813 Gralyn Rd
- 9809 Gralyn Rd
- 9901 Gralyn Rd
- 9820 Gralyn Rd
- 9900 Gralyn Rd
- 9816 Gralyn Rd
- 9804 Chambersbury Rd
- 9812 Gralyn Rd
- 9700 Charlton Ct
- 9904 Gralyn Rd
- 9805 Chambersbury Rd
- 9805 Wessex Ct
- 9800 Wessex Ct
- 9701 Charlton Ct
- 9705 Charlton Ct
- 9000 Hemmingwood Ct
- 9000 Hemingwood Ct
Your Personal Tour Guide
Ask me questions while you tour the home.