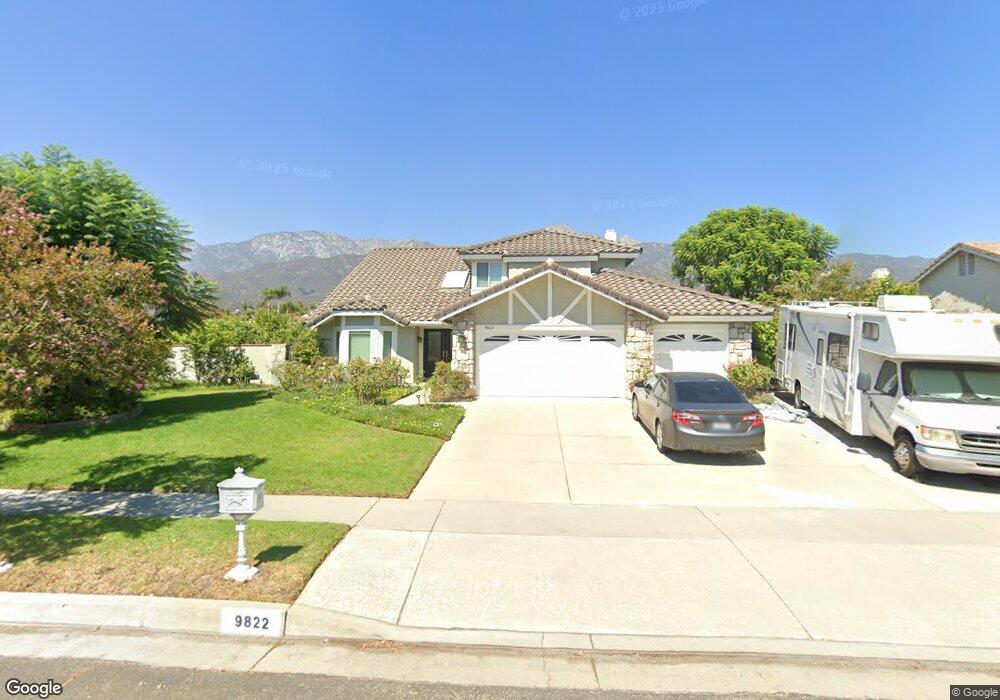
9822 Banyan St Rancho Cucamonga, CA 91737
Estimated Value: $855,036 - $1,047,000
4
Beds
3
Baths
2,009
Sq Ft
$488/Sq Ft
Est. Value
About This Home
This home is located at 9822 Banyan St, Rancho Cucamonga, CA 91737 and is currently estimated at $979,759, approximately $487 per square foot. 9822 Banyan St is a home located in San Bernardino County with nearby schools including Hermosa Elementary, Vineyard Junior High, and Los Osos High.
Ownership History
Date
Name
Owned For
Owner Type
Purchase Details
Closed on
Aug 15, 2025
Sold by
Sleigh Shu-Hui
Bought by
Shu-Hui Sleigh Trust and Sleigh
Current Estimated Value
Purchase Details
Closed on
Aug 17, 2020
Sold by
Sleigh Shu Hui and Sleigh Larry Bruce
Bought by
Sleigh Shu Hui
Purchase Details
Closed on
Jul 24, 2019
Sold by
Sleigh Shu Hui
Bought by
Sleigh Larry Bruce and Sleigh Shu Hui
Home Financials for this Owner
Home Financials are based on the most recent Mortgage that was taken out on this home.
Original Mortgage
$275,000
Interest Rate
3.8%
Mortgage Type
New Conventional
Purchase Details
Closed on
Apr 21, 2005
Sold by
Sleigh Larry B
Bought by
Sleigh Shu Hui
Home Financials for this Owner
Home Financials are based on the most recent Mortgage that was taken out on this home.
Original Mortgage
$175,000
Interest Rate
5.92%
Mortgage Type
Credit Line Revolving
Create a Home Valuation Report for This Property
The Home Valuation Report is an in-depth analysis detailing your home's value as well as a comparison with similar homes in the area
Home Values in the Area
Average Home Value in this Area
Purchase History
| Date | Buyer | Sale Price | Title Company |
|---|---|---|---|
| Shu-Hui Sleigh Trust | -- | None Listed On Document | |
| Sleigh Shu Hui | -- | Accommodation | |
| Sleigh Larry Bruce | -- | Ticor Title Company | |
| Sleigh Shu Hui | -- | -- |
Source: Public Records
Mortgage History
| Date | Status | Borrower | Loan Amount |
|---|---|---|---|
| Previous Owner | Sleigh Larry Bruce | $275,000 | |
| Previous Owner | Sleigh Shu Hui | $175,000 |
Source: Public Records
Tax History Compared to Growth
Tax History
| Year | Tax Paid | Tax Assessment Tax Assessment Total Assessment is a certain percentage of the fair market value that is determined by local assessors to be the total taxable value of land and additions on the property. | Land | Improvement |
|---|---|---|---|---|
| 2025 | $3,432 | $308,022 | $68,334 | $239,688 |
| 2024 | $3,432 | $301,982 | $66,994 | $234,988 |
| 2023 | $3,356 | $296,060 | $65,680 | $230,380 |
| 2022 | $3,347 | $290,255 | $64,392 | $225,863 |
| 2021 | $3,344 | $284,563 | $63,129 | $221,434 |
| 2020 | $3,213 | $281,645 | $62,482 | $219,163 |
| 2019 | $3,246 | $276,123 | $61,257 | $214,866 |
| 2018 | $3,175 | $270,709 | $60,056 | $210,653 |
| 2017 | $3,037 | $265,401 | $58,878 | $206,523 |
| 2016 | $2,957 | $260,198 | $57,724 | $202,474 |
| 2015 | $2,939 | $256,290 | $56,857 | $199,433 |
| 2014 | $2,859 | $251,269 | $55,743 | $195,526 |
Source: Public Records
Map
Nearby Homes
- 9855 Banyan St
- 6155 Klusman Ave
- 6360 Daylily Ct
- 5885 Zapata Place
- 9979 Timbermist Ct
- 10655 401 Lemon Ave Unit 401
- 6055 Amethyst Ave
- 9757 Balaton St
- 9504 Lemon Ave
- 10141 Orange St
- 9513 Sunflower St
- 9438 La Gloria Dr
- 6281 Kinlock Ave
- 10123 Finch Ave
- 10330 Orange St
- 6600 Montresor Place
- 10393 Cartilla Ct
- 6740 London Ave
- 6644 Brissac Place
- 6765 Jadeite Ave
- 9806 Banyan St
- 9836 Banyan St
- 9850 Banyan St
- 9821 Banyan St
- 9831 Banyan St
- 9809 Banyan St
- 9843 Banyan St
- 9864 Banyan St
- 6120 London Ave
- 6132 London Ave
- 6140 London Ave
- 9820 Liberty St
- 9834 Liberty St
- 9806 Liberty St
- 6150 London Ave
- 9867 Banyan St
- 6097 Burgundy Ave
- 9848 Liberty St
- 9878 Banyan St
- 6136 London Ave