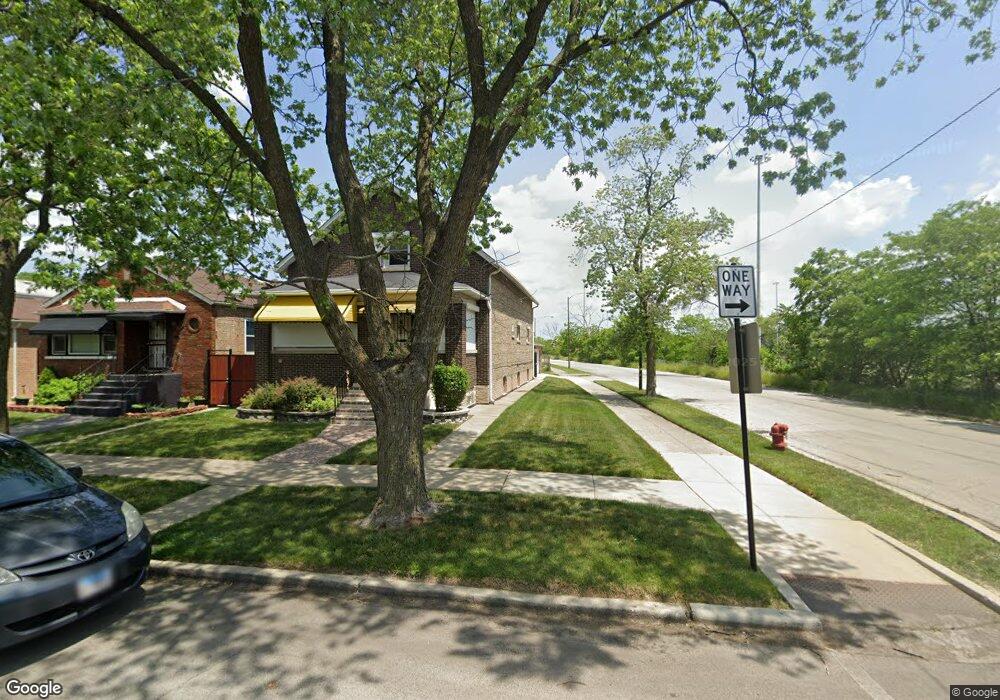
9823 S Harvard Ave Chicago, IL 60628
Roseland NeighborhoodEstimated Value: $172,883 - $222,000
3
Beds
1
Bath
1,431
Sq Ft
$136/Sq Ft
Est. Value
About This Home
This home is located at 9823 S Harvard Ave, Chicago, IL 60628 and is currently estimated at $194,721, approximately $136 per square foot. 9823 S Harvard Ave is a home located in Cook County with nearby schools including Evers Elementary School, Harlan Community Academy High School, and Christian S T E M Scholars.
Ownership History
Date
Name
Owned For
Owner Type
Purchase Details
Closed on
Jun 14, 2013
Sold by
Jefferson Juanita C
Bought by
Chicago Title Land Trust Co and Trust Number 8002362164
Current Estimated Value
Purchase Details
Closed on
Oct 23, 1996
Sold by
Thomas Evelyn Jones
Bought by
Cooks Kenneth L and Cooks Joyce
Home Financials for this Owner
Home Financials are based on the most recent Mortgage that was taken out on this home.
Original Mortgage
$82,464
Interest Rate
8.32%
Mortgage Type
FHA
Purchase Details
Closed on
Mar 15, 1995
Sold by
Jones Jerry
Bought by
Thomas Evely Jones
Purchase Details
Closed on
Feb 28, 1995
Sold by
Jones Phillip
Bought by
Thomas Evelyn Jones
Purchase Details
Closed on
Feb 27, 1995
Sold by
Jones John Thomas
Bought by
Thomas Evelyn Jones
Purchase Details
Closed on
Mar 24, 1979
Sold by
Chicago City Bank & Trust Company
Bought by
Jones Orlando
Create a Home Valuation Report for This Property
The Home Valuation Report is an in-depth analysis detailing your home's value as well as a comparison with similar homes in the area
Home Values in the Area
Average Home Value in this Area
Purchase History
| Date | Buyer | Sale Price | Title Company |
|---|---|---|---|
| Chicago Title Land Trust Co | -- | Chicago Title Land Trust Com | |
| Jefferson Juanita C | -- | Chicago Title Insurance Comp | |
| Cooks Kenneth L | $83,000 | -- | |
| Thomas Evely Jones | -- | -- | |
| Thomas Evelyn Jones | -- | -- | |
| Thomas Evelyn Jones | -- | -- | |
| Thomas Evelyn Jones | -- | -- | |
| Jones Orlando | -- | -- |
Source: Public Records
Mortgage History
| Date | Status | Borrower | Loan Amount |
|---|---|---|---|
| Previous Owner | Cooks Kenneth L | $82,464 |
Source: Public Records
Tax History Compared to Growth
Tax History
| Year | Tax Paid | Tax Assessment Tax Assessment Total Assessment is a certain percentage of the fair market value that is determined by local assessors to be the total taxable value of land and additions on the property. | Land | Improvement |
|---|---|---|---|---|
| 2024 | $7 | $11,000 | $3,673 | $7,327 |
| 2023 | -- | $6,001 | $2,900 | $3,101 |
| 2022 | $0 | $6,001 | $2,900 | $3,101 |
| 2021 | $82 | $5,999 | $2,899 | $3,100 |
| 2020 | $82 | $11,936 | $2,899 | $9,037 |
| 2019 | $82 | $13,117 | $2,899 | $10,218 |
| 2018 | $81 | $13,117 | $2,899 | $10,218 |
| 2017 | $87 | $13,280 | $2,512 | $10,768 |
| 2016 | $515 | $13,280 | $2,512 | $10,768 |
| 2015 | $495 | $13,280 | $2,512 | $10,768 |
| 2014 | $491 | $12,414 | $2,319 | $10,095 |
| 2013 | $492 | $12,414 | $2,319 | $10,095 |
Source: Public Records
Map
Nearby Homes
- 9747 S Harvard Ave
- 422 W 98th Place
- 400 W 99th Place
- 445 W 98th St
- 9745 S Wentworth Ave
- 9638 S Harvard Ave
- 10015 S Princeton Ave
- 9632 S Yale Ave
- 10012 S Yale Ave
- 9630 S Yale Ave
- 10016 S Yale Ave
- 10001 S Wentworth Ave
- 10020 S Wentworth Ave
- 9606 S Eggleston Ave
- 9930 S Perry Ave
- 520 W 97th St
- 347 W 101st Place
- 10102 S Yale Ave
- 10044 S La Salle St
- 10110 S Yale Ave
- 9821 S Harvard Ave
- 9817 S Harvard Ave
- 9815 S Harvard Ave
- 9811 S Harvard Ave
- 9818 S Princeton Ave
- 9807 S Harvard Ave
- 9816 S Princeton Ave
- 9812 S Princeton Ave
- 9805 S Harvard Ave
- 9810 S Princeton Ave
- 9806 S Princeton Ave
- 9801 S Harvard Ave
- 9804 S Princeton Ave
- 9820 S Harvard Ave
- 9818 S Harvard Ave
- 9816 S Harvard Ave
- 9800 S Princeton Ave
- 9814 S Harvard Ave
- 9814 S Harvard Ave
- 9810 S Harvard Ave