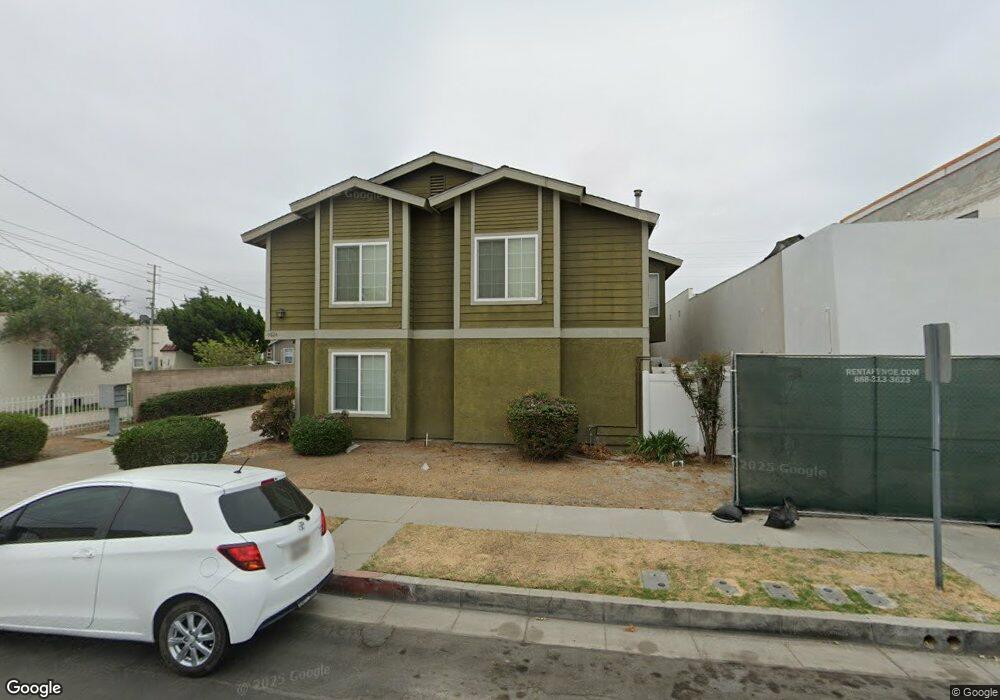
9824 Arkansas St Unit 1 Bellflower, CA 90706
Estimated Value: $520,000 - $703,000
3
Beds
2
Baths
1,079
Sq Ft
$530/Sq Ft
Est. Value
About This Home
This home is located at 9824 Arkansas St Unit 1, Bellflower, CA 90706 and is currently estimated at $571,864, approximately $529 per square foot. 9824 Arkansas St Unit 1 is a home located in Los Angeles County with nearby schools including Thomas Jefferson Elementary School, Mayfair High School, and St. Bernard School.
Ownership History
Date
Name
Owned For
Owner Type
Purchase Details
Closed on
Jan 18, 2013
Sold by
Printup Harvella L
Bought by
Printup Harvella L and Harvella Printup Family Trust
Current Estimated Value
Purchase Details
Closed on
Sep 28, 2012
Sold by
Printup Harvella Louise
Bought by
Printup Harvella L
Home Financials for this Owner
Home Financials are based on the most recent Mortgage that was taken out on this home.
Original Mortgage
$155,000
Outstanding Balance
$107,937
Interest Rate
3.63%
Mortgage Type
New Conventional
Estimated Equity
$463,927
Purchase Details
Closed on
Jul 16, 1998
Sold by
Brooks Thomas J and Brooks Jennifer S
Bought by
Printup Harvella Louise
Home Financials for this Owner
Home Financials are based on the most recent Mortgage that was taken out on this home.
Original Mortgage
$111,600
Interest Rate
6.9%
Mortgage Type
Purchase Money Mortgage
Create a Home Valuation Report for This Property
The Home Valuation Report is an in-depth analysis detailing your home's value as well as a comparison with similar homes in the area
Home Values in the Area
Average Home Value in this Area
Purchase History
| Date | Buyer | Sale Price | Title Company |
|---|---|---|---|
| Printup Harvella L | -- | None Available | |
| Printup Harvella L | -- | Equity Title | |
| Printup Harvella Louise | $124,000 | Landsafe Title | |
| Brooks Thomas J | -- | Landsafe Title |
Source: Public Records
Mortgage History
| Date | Status | Borrower | Loan Amount |
|---|---|---|---|
| Open | Printup Harvella L | $155,000 | |
| Previous Owner | Printup Harvella Louise | $111,600 |
Source: Public Records
Tax History Compared to Growth
Tax History
| Year | Tax Paid | Tax Assessment Tax Assessment Total Assessment is a certain percentage of the fair market value that is determined by local assessors to be the total taxable value of land and additions on the property. | Land | Improvement |
|---|---|---|---|---|
| 2025 | $2,586 | $194,366 | $46,857 | $147,509 |
| 2024 | $2,586 | $190,556 | $45,939 | $144,617 |
| 2023 | $2,489 | $186,821 | $45,039 | $141,782 |
| 2022 | $2,443 | $183,158 | $44,156 | $139,002 |
| 2021 | $2,391 | $179,568 | $43,291 | $136,277 |
| 2020 | $2,369 | $177,728 | $42,848 | $134,880 |
| 2019 | $2,329 | $174,244 | $42,008 | $132,236 |
| 2018 | $2,244 | $170,829 | $41,185 | $129,644 |
| 2016 | $2,147 | $164,197 | $39,587 | $124,610 |
| 2015 | $2,104 | $161,732 | $38,993 | $122,739 |
| 2014 | $2,081 | $158,565 | $38,230 | $120,335 |
Source: Public Records
Map
Nearby Homes
- 9833 Walnut St
- 9929 Park St
- 9833 Palm St
- 16712 Bellflower Blvd
- 16821 Ardmore Ave
- 10117 Palm St
- 9719 Belmont St
- 9716 Oak St
- 10013 Flora Vista St
- 9921 Flora Vista St Unit 5
- 16414 Cornuta Ave Unit 8
- 16414 Cornuta Ave Unit 11
- 9713 Cedar St
- 17046 Clark Ave
- 9928 Cedar St
- 9924 Cedar St
- 9513 Cedar St
- 10240 Artesia Blvd
- 9527 Los Angeles St
- 9334 Alondra Blvd
- 9824 Arkansas St
- 9824 Arkansas St Unit 4
- 9824 Arkansas St Unit 3
- 9824 Arkansas St Unit 2
- 9830 Arkansas St
- 9827 Park St Unit 4
- 9827 Park St Unit 3
- 9827 Park St Unit 2
- 9827 Park St Unit 1
- 9836 Arkansas St
- 9831 Park St Unit 1
- 9817 Arkansas St
- 9841 Park St
- 9846 Arkansas St
- 17018 Rush Ave
- 17046 Bellflower Blvd
- 9845 Park St
- 9839 Arkansas St
- 9850 Arkansas St
- 17014 Rush Ave