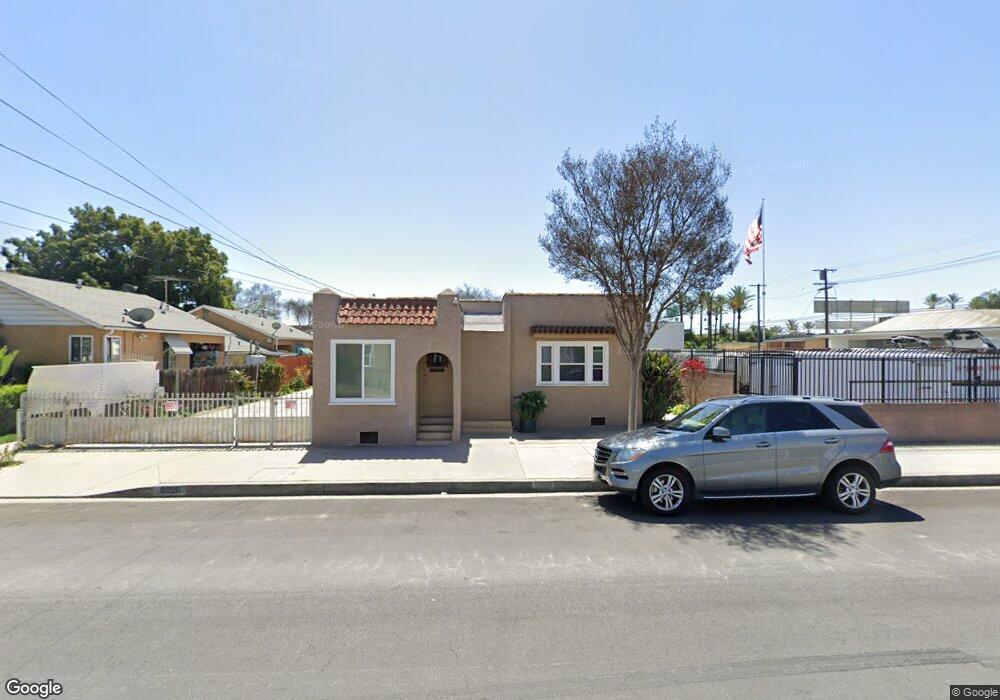
9826 Beach St Bellflower, CA 90706
Estimated Value: $896,000 - $955,000
3
Beds
2
Baths
1,716
Sq Ft
$541/Sq Ft
Est. Value
About This Home
This home is located at 9826 Beach St, Bellflower, CA 90706 and is currently estimated at $928,627, approximately $541 per square foot. 9826 Beach St is a home located in Los Angeles County with nearby schools including Thomas Jefferson Elementary School, Mayfair High School, and St. Bernard School.
Ownership History
Date
Name
Owned For
Owner Type
Purchase Details
Closed on
Jan 21, 2015
Sold by
Montoya Gustavo
Bought by
Montoya Gustavo and Montoya Ana P
Current Estimated Value
Home Financials for this Owner
Home Financials are based on the most recent Mortgage that was taken out on this home.
Original Mortgage
$302,000
Outstanding Balance
$230,548
Interest Rate
3.75%
Mortgage Type
New Conventional
Estimated Equity
$698,079
Purchase Details
Closed on
Jun 8, 2010
Sold by
Resh Gerge D and Hill Revocable Livin Phyllis M
Bought by
Montoya Gustavo
Home Financials for this Owner
Home Financials are based on the most recent Mortgage that was taken out on this home.
Original Mortgage
$315,748
Interest Rate
4.79%
Mortgage Type
FHA
Purchase Details
Closed on
Mar 18, 2002
Sold by
Hill Phyllis M
Bought by
The Phyllis M Hill Revocable Living Tr
Create a Home Valuation Report for This Property
The Home Valuation Report is an in-depth analysis detailing your home's value as well as a comparison with similar homes in the area
Home Values in the Area
Average Home Value in this Area
Purchase History
| Date | Buyer | Sale Price | Title Company |
|---|---|---|---|
| Montoya Gustavo | -- | Fidelity National Title | |
| Montoya Gustavo | $325,000 | Calcounties Title Nation | |
| The Phyllis M Hill Revocable Living Tr | -- | -- | |
| Hill Phyllis M | -- | -- |
Source: Public Records
Mortgage History
| Date | Status | Borrower | Loan Amount |
|---|---|---|---|
| Open | Montoya Gustavo | $302,000 | |
| Closed | Montoya Gustavo | $315,748 |
Source: Public Records
Tax History
| Year | Tax Paid | Tax Assessment Tax Assessment Total Assessment is a certain percentage of the fair market value that is determined by local assessors to be the total taxable value of land and additions on the property. | Land | Improvement |
|---|---|---|---|---|
| 2025 | $5,248 | $416,372 | $310,039 | $106,333 |
| 2024 | $5,248 | $408,209 | $303,960 | $104,249 |
| 2023 | $5,044 | $400,205 | $298,000 | $102,205 |
| 2022 | $4,955 | $392,358 | $292,157 | $100,201 |
| 2021 | $4,851 | $384,666 | $286,429 | $98,237 |
| 2019 | $4,728 | $373,259 | $277,935 | $95,324 |
| 2018 | $4,485 | $365,941 | $272,486 | $93,455 |
| 2016 | $4,298 | $351,733 | $261,906 | $89,827 |
| 2015 | $4,209 | $346,450 | $257,972 | $88,478 |
| 2014 | $4,155 | $339,664 | $252,919 | $86,745 |
Source: Public Records
Map
Nearby Homes
- 9929 Park St
- 9725 Arkansas St
- 16924 Bixby Ave
- 10117 Palm St
- 16712 Bellflower Blvd
- 16919 Ardmore Ave
- 16822 Ardmore Ave
- 9559 Flower St
- 17013 California Ave
- 10241 Flora Vista St
- 9545 Flower St
- 10292 Artesia Blvd
- 16414 Cornuta Ave Unit 8
- 9921 Flora Vista St Unit 5
- 9921 Flora Vista St Unit 6
- 17046 Clark Ave
- 16331 Cornuta Ave Unit E
- 10405 Park St
- 9601 Mayne St
- 9520 Mayne St
Your Personal Tour Guide
Ask me questions while you tour the home.