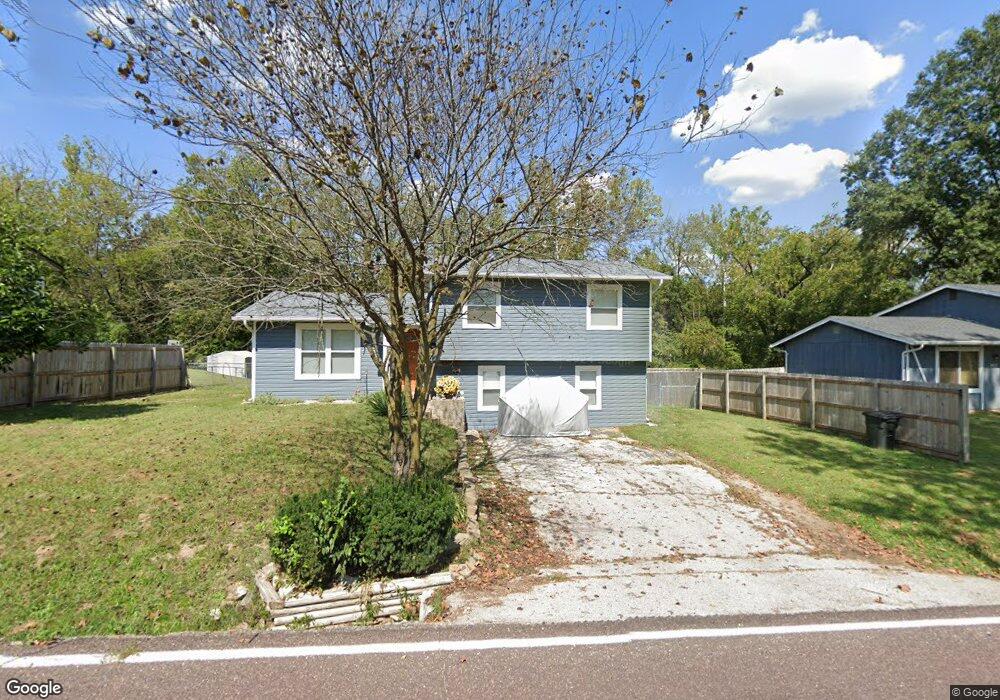
9826 Sandy Church Rd Hillsboro, MO 63050
Estimated Value: $160,000 - $223,000
--
Bed
--
Bath
882
Sq Ft
$214/Sq Ft
Est. Value
About This Home
This home is located at 9826 Sandy Church Rd, Hillsboro, MO 63050 and is currently estimated at $188,385, approximately $213 per square foot. 9826 Sandy Church Rd is a home located in Jefferson County with nearby schools including Hillsboro Primary School, Hillsboro Elementary School, and Hillsboro Middle Elementary School.
Ownership History
Date
Name
Owned For
Owner Type
Purchase Details
Closed on
Aug 31, 2020
Sold by
Messer Jonathan L
Bought by
Messer Jonathan L and Messer Michelle
Current Estimated Value
Home Financials for this Owner
Home Financials are based on the most recent Mortgage that was taken out on this home.
Original Mortgage
$74,000
Outstanding Balance
$52,807
Interest Rate
2.9%
Mortgage Type
New Conventional
Estimated Equity
$135,578
Purchase Details
Closed on
Nov 21, 2003
Sold by
Bovaconti William W and Bovaconti Deanna D
Bought by
Messer Jonathan L
Home Financials for this Owner
Home Financials are based on the most recent Mortgage that was taken out on this home.
Original Mortgage
$96,500
Interest Rate
5.93%
Mortgage Type
VA
Purchase Details
Closed on
Aug 8, 1997
Sold by
Vandiver Shane E
Bought by
Bovaconti William W and Bovaconti Deanna D
Home Financials for this Owner
Home Financials are based on the most recent Mortgage that was taken out on this home.
Original Mortgage
$64,500
Interest Rate
7.6%
Create a Home Valuation Report for This Property
The Home Valuation Report is an in-depth analysis detailing your home's value as well as a comparison with similar homes in the area
Home Values in the Area
Average Home Value in this Area
Purchase History
| Date | Buyer | Sale Price | Title Company |
|---|---|---|---|
| Messer Jonathan L | -- | None Available | |
| Messer Jonathan L | -- | -- | |
| Bovaconti William W | -- | -- |
Source: Public Records
Mortgage History
| Date | Status | Borrower | Loan Amount |
|---|---|---|---|
| Open | Messer Jonathan L | $74,000 | |
| Closed | Messer Jonathan L | $96,500 | |
| Previous Owner | Bovaconti William W | $64,500 |
Source: Public Records
Tax History Compared to Growth
Tax History
| Year | Tax Paid | Tax Assessment Tax Assessment Total Assessment is a certain percentage of the fair market value that is determined by local assessors to be the total taxable value of land and additions on the property. | Land | Improvement |
|---|---|---|---|---|
| 2025 | $1,092 | $19,000 | $1,300 | $17,700 |
| 2024 | $1,092 | $17,400 | $1,300 | $16,100 |
| 2023 | $1,092 | $17,400 | $1,300 | $16,100 |
| 2022 | $1,186 | $17,400 | $1,300 | $16,100 |
| 2021 | $1,186 | $17,400 | $1,300 | $16,100 |
| 2020 | $1,104 | $15,700 | $1,000 | $14,700 |
| 2019 | $1,104 | $15,700 | $1,000 | $14,700 |
| 2018 | $1,103 | $15,700 | $1,000 | $14,700 |
| 2017 | $1,049 | $15,700 | $1,000 | $14,700 |
| 2016 | $959 | $14,200 | $1,000 | $13,200 |
| 2015 | $884 | $14,200 | $1,000 | $13,200 |
| 2013 | -- | $13,700 | $1,000 | $12,700 |
Source: Public Records
Map
Nearby Homes
- 176 Pancho Villa Dr
- 3644 Crestview Dr
- 4 Cedar Creek
- 9822 Woodland Rd
- 3532 Ketha Heights
- 4005 Twinbrook Rd
- 3333 Ketha Cir
- 4295 Hansard Ln
- 18 Meadow Ridge
- 9904 Lockeport Point
- 1 Appomattox Ridge
- 9873 Goldman Rd
- 9448 Ponderosa Ln
- 10610 Stroup Rd
- 9213 Church Dr
- 3900 Rice Rd
- 10507 Glen Oaks Dr
- 9365 Elm Loop Dr
- 0 Hwy A 62 Acres Unit 20012897
- 2313 Oak Forest Dr
- 9832 Sandy Church Rd
- 9820 Sandy Church Rd
- 9838 Sandy Church Rd
- 9814 Sandy Church Rd
- 9802 Osage Dr
- 9837 Sandy Church Rd
- 9844 Sandy Church Rd
- 9808 Sandy Church Rd
- 9808 Osage Dr
- 9850 Sandy Church Rd
- 9809 Sandy Church Rd
- 9796 Sandy Church Rd
- 9814 Osage Dr
- 3748 La Somera Dr
- 40 Cimeron Dr
- 9815 Osage Dr
- 9820 Osage Dr
- 3754 La Somera Dr
- 46 Cimeron Dr
- 17 Donna Dr