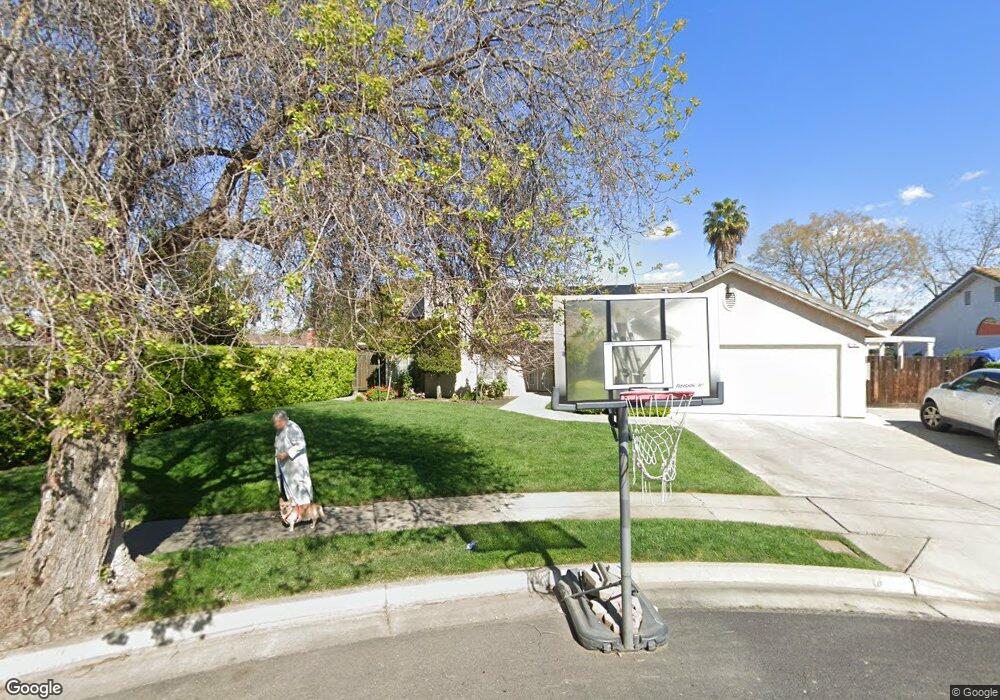
983 Harrison Ct Madera, CA 93637
West Madera NeighborhoodEstimated Value: $362,000 - $396,000
3
Beds
2
Baths
1,417
Sq Ft
$271/Sq Ft
Est. Value
About This Home
This home is located at 983 Harrison Ct, Madera, CA 93637 and is currently estimated at $384,325, approximately $271 per square foot. 983 Harrison Ct is a home located in Madera County with nearby schools including John Adams Elementary School, Thomas Jefferson Middle School, and Madera High School.
Ownership History
Date
Name
Owned For
Owner Type
Purchase Details
Closed on
Nov 1, 2017
Sold by
Howery Jeffrey and Harris Lisa
Bought by
Andrade Lozano David and Andrade Lozano Angela
Current Estimated Value
Home Financials for this Owner
Home Financials are based on the most recent Mortgage that was taken out on this home.
Original Mortgage
$221,160
Outstanding Balance
$185,760
Interest Rate
3.94%
Mortgage Type
New Conventional
Estimated Equity
$198,565
Purchase Details
Closed on
Sep 19, 2008
Sold by
Hsbc Mortgage Services Inc
Bought by
Howery Jeffrey and Harris Lisa
Home Financials for this Owner
Home Financials are based on the most recent Mortgage that was taken out on this home.
Original Mortgage
$170,786
Interest Rate
6.39%
Mortgage Type
FHA
Purchase Details
Closed on
Jun 24, 2008
Sold by
Williams Ronald J and Williams Cheryl D
Bought by
Hsbc Mortgage Services Inc
Purchase Details
Closed on
Mar 30, 2000
Sold by
Varjabedian Michael C
Bought by
Varjabedian Michael C
Create a Home Valuation Report for This Property
The Home Valuation Report is an in-depth analysis detailing your home's value as well as a comparison with similar homes in the area
Home Values in the Area
Average Home Value in this Area
Purchase History
| Date | Buyer | Sale Price | Title Company |
|---|---|---|---|
| Andrade Lozano David | $228,000 | Chicago Title Company | |
| Howery Jeffrey | $173,500 | None Available | |
| Hsbc Mortgage Services Inc | $154,700 | None Available | |
| Varjabedian Michael C | -- | -- |
Source: Public Records
Mortgage History
| Date | Status | Borrower | Loan Amount |
|---|---|---|---|
| Open | Andrade Lozano David | $221,160 | |
| Previous Owner | Howery Jeffrey | $170,786 |
Source: Public Records
Tax History
| Year | Tax Paid | Tax Assessment Tax Assessment Total Assessment is a certain percentage of the fair market value that is determined by local assessors to be the total taxable value of land and additions on the property. | Land | Improvement |
|---|---|---|---|---|
| 2025 | $3,018 | $259,420 | $45,510 | $213,910 |
| 2023 | $3,018 | $249,348 | $43,744 | $205,604 |
| 2022 | $2,820 | $244,460 | $42,887 | $201,573 |
| 2021 | $2,768 | $239,668 | $42,047 | $197,621 |
| 2020 | $2,818 | $237,211 | $41,616 | $195,595 |
| 2019 | $2,797 | $232,560 | $40,800 | $191,760 |
| 2018 | $2,581 | $228,000 | $40,000 | $188,000 |
| 2017 | $1,958 | $178,056 | $81,843 | $96,213 |
| 2016 | $1,908 | $174,564 | $75,336 | $99,228 |
| 2015 | $1,831 | $168,156 | $74,606 | $93,550 |
| 2014 | $1,593 | $154,272 | $68,446 | $85,826 |
Source: Public Records
Map
Nearby Homes
- 1637 Princeton Ave
- 15707 Road 22 1 2
- 1632 University Ave
- 991 Baylor Ct
- 716 Willis Ave
- 2436 Trevor Ct
- 2377 Frederick Way
- 1803 Sunset Ave
- 901 Valley Way
- 2411 Driftwood Dr
- 174 N Park Dr
- 1237 de Cesari Ave
- 2512 Driftwood Dr
- 157 N Park Dr
- 1457 Deborah Ln
- 3 West Loop
- 430 Rotan Ave
- 1555 Taylor Ln
- 2520 Meadowrest Way
- 2610 Marie Dr
- 973 Harrison Ct
- 990 Jackson Ct
- 1816 Riverview Dr
- 980 Jackson Ct
- 1900 Riverview Dr
- 1812 Riverview Dr
- 963 Harrison Ct
- 970 Jackson Ct
- 982 Harrison Ct
- 972 Harrison Ct
- 1904 Riverview Dr
- 1808 Riverview Dr
- 953 Harrison Ct
- 962 Harrison Ct
- 950 Jackson Ct
- 1908 Riverview Dr
- 1010 Orchard Ave
- 995 Arthur Ct
- 952 Harrison Ct
- 991 Jackson Ct
Your Personal Tour Guide
Ask me questions while you tour the home.