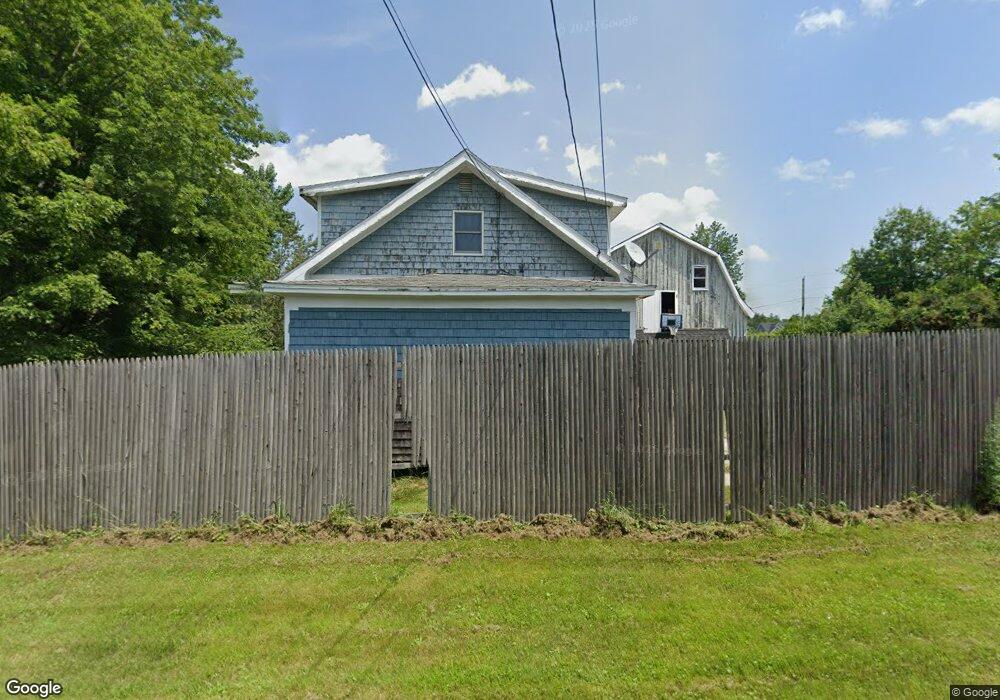
983 Ohio St Bangor, ME 04401
West Bangor NeighborhoodEstimated Value: $272,000 - $371,000
3
Beds
2
Baths
1,800
Sq Ft
$172/Sq Ft
Est. Value
About This Home
This home is located at 983 Ohio St, Bangor, ME 04401 and is currently estimated at $309,340, approximately $171 per square foot. 983 Ohio St is a home located in Penobscot County with nearby schools including Fourteenth Street School, Fairmount School, and James F. Doughty School.
Ownership History
Date
Name
Owned For
Owner Type
Purchase Details
Closed on
Apr 10, 2012
Sold by
Hallissey Brendan J
Bought by
Hagerman Elizabeth
Current Estimated Value
Home Financials for this Owner
Home Financials are based on the most recent Mortgage that was taken out on this home.
Original Mortgage
$134,501
Interest Rate
3.87%
Mortgage Type
FHA
Purchase Details
Closed on
Jun 30, 2006
Sold by
Thomas Scott A
Bought by
Hallissey Brendan J
Home Financials for this Owner
Home Financials are based on the most recent Mortgage that was taken out on this home.
Original Mortgage
$96,000
Interest Rate
6%
Mortgage Type
Adjustable Rate Mortgage/ARM
Create a Home Valuation Report for This Property
The Home Valuation Report is an in-depth analysis detailing your home's value as well as a comparison with similar homes in the area
Home Values in the Area
Average Home Value in this Area
Purchase History
| Date | Buyer | Sale Price | Title Company |
|---|---|---|---|
| Hagerman Elizabeth | -- | -- | |
| Hallissey Brendan J | -- | -- |
Source: Public Records
Mortgage History
| Date | Status | Borrower | Loan Amount |
|---|---|---|---|
| Closed | Hagerman Elizabeth | $134,501 | |
| Closed | Hallissey Brendan J | $96,000 |
Source: Public Records
Tax History Compared to Growth
Tax History
| Year | Tax Paid | Tax Assessment Tax Assessment Total Assessment is a certain percentage of the fair market value that is determined by local assessors to be the total taxable value of land and additions on the property. | Land | Improvement |
|---|---|---|---|---|
| 2024 | $3,866 | $208,400 | $41,700 | $166,700 |
| 2023 | $3,677 | $192,000 | $41,700 | $150,300 |
| 2022 | $3,264 | $160,000 | $39,200 | $120,800 |
| 2021 | $3,158 | $141,600 | $36,300 | $105,300 |
| 2020 | $3,188 | $137,400 | $36,300 | $101,100 |
| 2019 | $3,073 | $133,600 | $36,300 | $97,300 |
| 2018 | $2,811 | $122,500 | $37,700 | $84,800 |
| 2017 | $2,724 | $120,800 | $37,700 | $83,100 |
| 2016 | $2,671 | $118,700 | $37,700 | $81,000 |
| 2015 | $2,630 | $119,800 | $37,700 | $82,100 |
| 2014 | $2,599 | $119,200 | $37,700 | $81,500 |
| 2013 | $2,484 | $119,400 | $37,700 | $81,700 |
Source: Public Records
Map
Nearby Homes
- 68 Bean Estates
- 850 Ohio St
- 826 Ohio St Unit 5
- 27 Maxwell Ln
- 541 Kenduskeag Ave Unit A1
- 42 Yankee Ave
- 18 Blanchard St
- 35 Dunning Blvd
- 21 Yankee Ave
- Map R12 Lot 3
- 250 Husson Ave Unit 1D
- 41 Dana Dr
- 103 Sherman Ave
- 48 16th St
- 176 Falvey St
- 31 15th St
- 43 Baldwin Dr
- Lot #19 Broadway
- 58 Brighton Ave
- 66 Mount Desert Dr