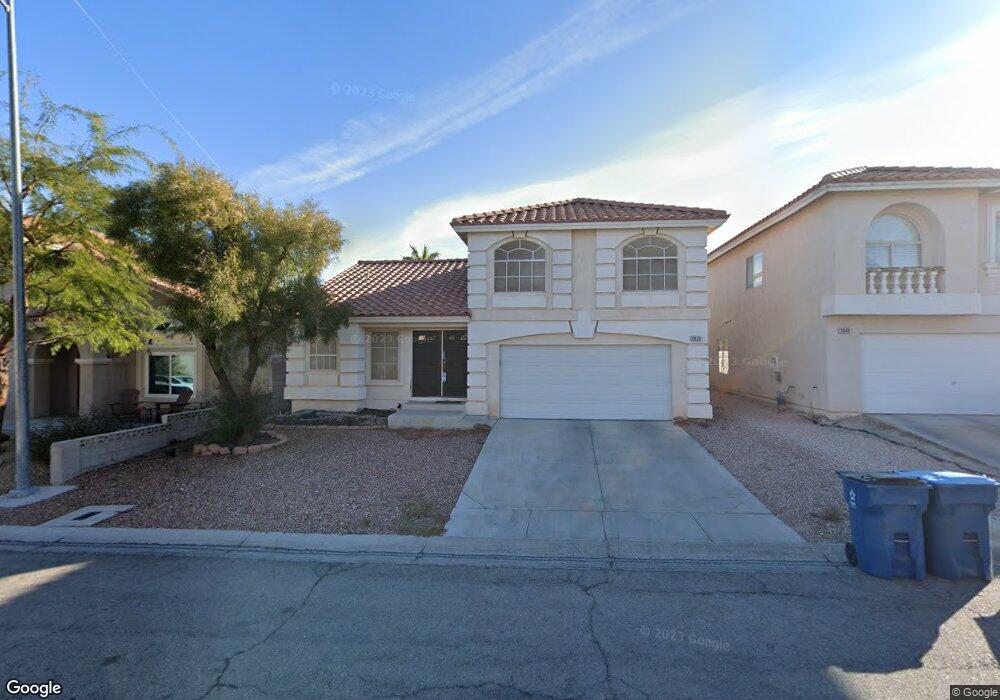
9830 Silver Dew St Las Vegas, NV 89183
Silverado Ranch NeighborhoodEstimated Value: $457,000 - $486,000
3
Beds
3
Baths
1,635
Sq Ft
$287/Sq Ft
Est. Value
About This Home
This home is located at 9830 Silver Dew St, Las Vegas, NV 89183 and is currently estimated at $468,502, approximately $286 per square foot. 9830 Silver Dew St is a home located in Clark County with nearby schools including Roberta C Cartwright Elementary School, Charles Silvestri Junior High School, and Liberty High School.
Ownership History
Date
Name
Owned For
Owner Type
Purchase Details
Closed on
Oct 16, 2006
Sold by
Brooks Victor E and Brooks Connie J
Bought by
Brooks Nicholas O
Current Estimated Value
Home Financials for this Owner
Home Financials are based on the most recent Mortgage that was taken out on this home.
Original Mortgage
$252,000
Outstanding Balance
$150,706
Interest Rate
6.5%
Mortgage Type
Unknown
Estimated Equity
$317,796
Purchase Details
Closed on
Sep 27, 2005
Sold by
Brooks Victor E and Brooks Connie J
Bought by
Brooks Victor E and Brooks Connie J
Purchase Details
Closed on
Nov 20, 2002
Sold by
Levinson Neeson T and Levinson Melissa M
Bought by
Brooks Victor E and Brooks Connie J
Home Financials for this Owner
Home Financials are based on the most recent Mortgage that was taken out on this home.
Original Mortgage
$188,550
Interest Rate
6.28%
Purchase Details
Closed on
Aug 4, 1998
Sold by
American West Homes Inc
Bought by
Levinson Neeson T and Levinson Melissa M
Home Financials for this Owner
Home Financials are based on the most recent Mortgage that was taken out on this home.
Original Mortgage
$141,650
Interest Rate
6.95%
Mortgage Type
VA
Create a Home Valuation Report for This Property
The Home Valuation Report is an in-depth analysis detailing your home's value as well as a comparison with similar homes in the area
Home Values in the Area
Average Home Value in this Area
Purchase History
| Date | Buyer | Sale Price | Title Company |
|---|---|---|---|
| Brooks Nicholas O | $315,000 | Nevada Title Company | |
| Brooks Victor E | $198,500 | -- | |
| Brooks Victor E | $198,500 | Nevada Title Company | |
| Levinson Neeson T | $142,000 | First American Title Co |
Source: Public Records
Mortgage History
| Date | Status | Borrower | Loan Amount |
|---|---|---|---|
| Open | Brooks Nicholas O | $252,000 | |
| Previous Owner | Brooks Victor E | $188,550 | |
| Previous Owner | Levinson Neeson T | $141,650 |
Source: Public Records
Tax History Compared to Growth
Tax History
| Year | Tax Paid | Tax Assessment Tax Assessment Total Assessment is a certain percentage of the fair market value that is determined by local assessors to be the total taxable value of land and additions on the property. | Land | Improvement |
|---|---|---|---|---|
| 2025 | $2,495 | $108,378 | $40,600 | $67,778 |
| 2024 | $2,311 | $108,378 | $40,600 | $67,778 |
| 2023 | $1,539 | $99,089 | $35,000 | $64,089 |
| 2022 | $2,140 | $90,375 | $31,500 | $58,875 |
| 2021 | $1,982 | $84,738 | $28,700 | $56,038 |
| 2020 | $1,837 | $83,355 | $27,650 | $55,705 |
| 2019 | $1,722 | $79,345 | $24,500 | $54,845 |
| 2018 | $1,643 | $71,631 | $18,900 | $52,731 |
| 2017 | $2,104 | $71,749 | $18,200 | $53,549 |
| 2016 | $1,539 | $68,518 | $15,050 | $53,468 |
| 2015 | $1,535 | $59,257 | $11,200 | $48,057 |
| 2014 | $1,490 | $49,299 | $8,750 | $40,549 |
Source: Public Records
Map
Nearby Homes
- 9851 Silver Dew St
- 9793 Silver Lasso St
- 2300 E Silverado Ranch Blvd Unit 2112
- 2300 E Silverado Ranch Blvd Unit 2033
- 2300 E Silverado Ranch Blvd Unit 2161
- 2300 E Silverado Ranch Blvd Unit 1080
- 2300 E Silverado Ranch Blvd Unit 1106
- 2300 E Silverado Ranch Blvd Unit 2196
- 2300 E Silverado Ranch Blvd Unit 2158
- 2300 E Silverado Ranch Blvd Unit 1074
- 2300 E Silverado Ranch Blvd Unit 1180
- 2300 E Silverado Ranch Blvd Unit 2133
- 2300 E Silverado Ranch Blvd Unit 2162
- 2300 E Silverado Ranch Blvd Unit 2040
- 2300 E Silverado Ranch Blvd Unit 1151
- 2300 E Silverado Ranch Blvd Unit 1072
- 1846 Autumn Gold Ave
- 2013 Spiers Ave
- 9994 Government Point Way Unit 101
- 9620 Orchid Bay Dr
- 9840 Silver Dew St
- 9820 Silver Dew St
- 9850 Silver Dew St
- 9810 Silver Dew St
- 9831 Silver Dew St
- 9821 Silver Dew St
- 9800 Silver Dew St
- 9860 Silver Dew St
- 9841 Silver Dew St
- 9811 Silver Dew St
- 9801 Silver Dew St
- 9870 Silver Dew St Unit n/a
- 9870 Silver Dew St
- 9790 Silver Dew St
- 9790 Silver Dew St
- 9861 Silver Dew St
- 9791 Silver Dew St
- 9791 Silver Dew St
- 9832 Silver Chimes Ct
- 9822 Silver Chimes Ct