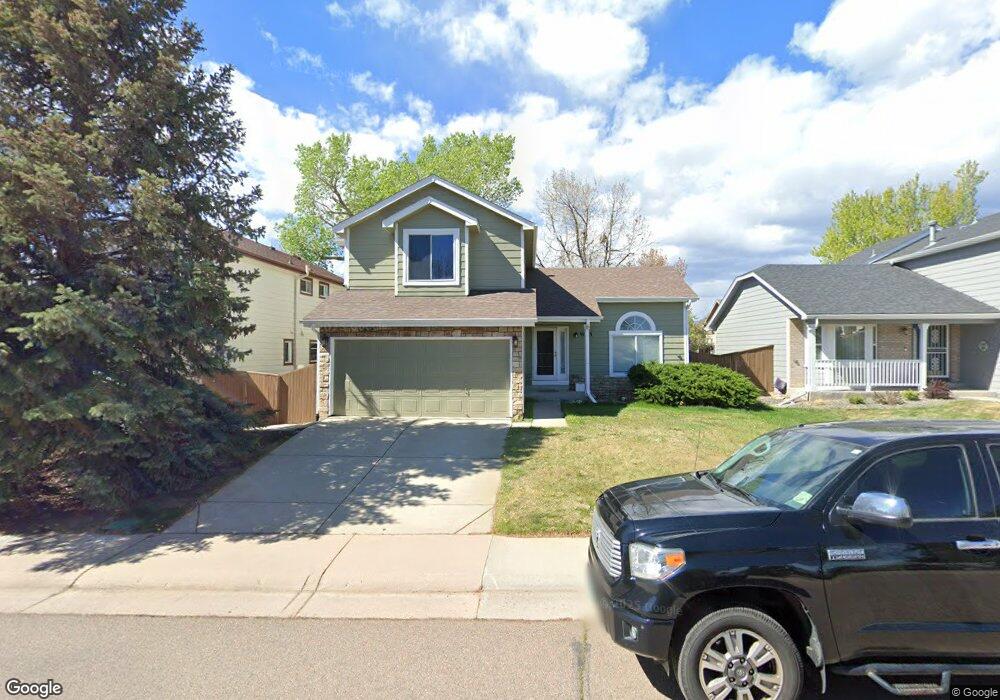
9833 Rock Dove Ln Highlands Ranch, CO 80129
Westridge NeighborhoodEstimated Value: $604,171 - $664,000
3
Beds
4
Baths
1,794
Sq Ft
$354/Sq Ft
Est. Value
About This Home
This home is located at 9833 Rock Dove Ln, Highlands Ranch, CO 80129 and is currently estimated at $634,293, approximately $353 per square foot. 9833 Rock Dove Ln is a home located in Douglas County with nearby schools including Trailblazer Elementary School, Ranch View Middle School, and Thunderridge High School.
Ownership History
Date
Name
Owned For
Owner Type
Purchase Details
Closed on
May 31, 2002
Sold by
Ramirez John R and Ramirez Diana G
Bought by
Goodwin J Kenneth J and Goodwin Nancy E
Current Estimated Value
Home Financials for this Owner
Home Financials are based on the most recent Mortgage that was taken out on this home.
Original Mortgage
$230,354
Outstanding Balance
$97,468
Interest Rate
6.82%
Mortgage Type
FHA
Estimated Equity
$536,825
Purchase Details
Closed on
Oct 16, 1997
Sold by
Murray Joss and Murray Stacey
Bought by
Ramirez John R and Ramirez Diana G
Home Financials for this Owner
Home Financials are based on the most recent Mortgage that was taken out on this home.
Original Mortgage
$151,541
Interest Rate
7.54%
Mortgage Type
FHA
Purchase Details
Closed on
Nov 14, 1991
Sold by
Homeland Communities Colo Inc
Bought by
Joss Murray and Joss Stacey
Purchase Details
Closed on
Jun 28, 1991
Sold by
Mission Viejo Co
Bought by
Homeland Communities Colo Inc
Create a Home Valuation Report for This Property
The Home Valuation Report is an in-depth analysis detailing your home's value as well as a comparison with similar homes in the area
Home Values in the Area
Average Home Value in this Area
Purchase History
| Date | Buyer | Sale Price | Title Company |
|---|---|---|---|
| Goodwin J Kenneth J | $234,000 | Guardian Title Agency Llc | |
| Ramirez John R | $156,500 | First American Heritage Titl | |
| Joss Murray | $107,300 | -- | |
| Homeland Communities Colo Inc | -- | -- |
Source: Public Records
Mortgage History
| Date | Status | Borrower | Loan Amount |
|---|---|---|---|
| Open | Goodwin J Kenneth J | $230,354 | |
| Previous Owner | Ramirez John R | $151,541 |
Source: Public Records
Tax History Compared to Growth
Tax History
| Year | Tax Paid | Tax Assessment Tax Assessment Total Assessment is a certain percentage of the fair market value that is determined by local assessors to be the total taxable value of land and additions on the property. | Land | Improvement |
|---|---|---|---|---|
| 2024 | $3,757 | $43,540 | $9,060 | $34,480 |
| 2023 | $3,750 | $43,540 | $9,060 | $34,480 |
| 2022 | $2,833 | $31,010 | $6,240 | $24,770 |
| 2021 | $2,946 | $31,010 | $6,240 | $24,770 |
| 2020 | $2,751 | $29,660 | $5,910 | $23,750 |
| 2019 | $2,761 | $29,660 | $5,910 | $23,750 |
| 2018 | $2,417 | $25,570 | $5,210 | $20,360 |
| 2017 | $2,200 | $25,570 | $5,210 | $20,360 |
| 2016 | $2,044 | $23,310 | $4,410 | $18,900 |
| 2015 | $2,088 | $23,310 | $4,410 | $18,900 |
| 2014 | $1,881 | $19,390 | $4,540 | $14,850 |
Source: Public Records
Map
Nearby Homes
- 9821 Rock Dove Ln
- 3644 Rosewalk Cir
- 3641 Rosewalk Cir
- 9711 Bucknell Way
- 10054 Deer Creek St
- 9755 Spring Hill St
- 9488 S Hackberry Ln
- 9477 S Hackberry Ln
- 9409 S Hackberry Ln
- 2841 High Cliffe Place
- 10347 Woodrose Ln
- 1993 Mountain Maple Ave
- 10505 Hyacinth Place
- 2627 Baneberry Ln
- 1864 Mountain Maple Ave
- 9227 Gold Lace Place
- 9178 Gold Lace Place
- 2174 Cactus Bluff Ave
- 10672 Hyacinth St
- 10578 Hyacinth Ln
- 9829 Rock Dove Ln
- 9837 Rock Dove Ln
- 9920 Deer Creek St
- 9924 Deer Creek St
- 9825 Rock Dove Ln
- 9901 Foxhill Cir
- 9902 Deer Creek St
- 9834 Goldfinch Ln
- 9928 Deer Creek St
- 9779 Foxhill Cir
- 9895 Foxhill Cir
- 9903 Foxhill Cir
- 9830 Goldfinch Ln
- 9835 Goldfinch Ln
- 9781 Foxhill Cir
- 9893 Foxhill Cir
- 9932 Deer Creek St
- 9817 Rock Dove Ln
- 9825 Goldfinch Ln
- 9919 Deer Creek St