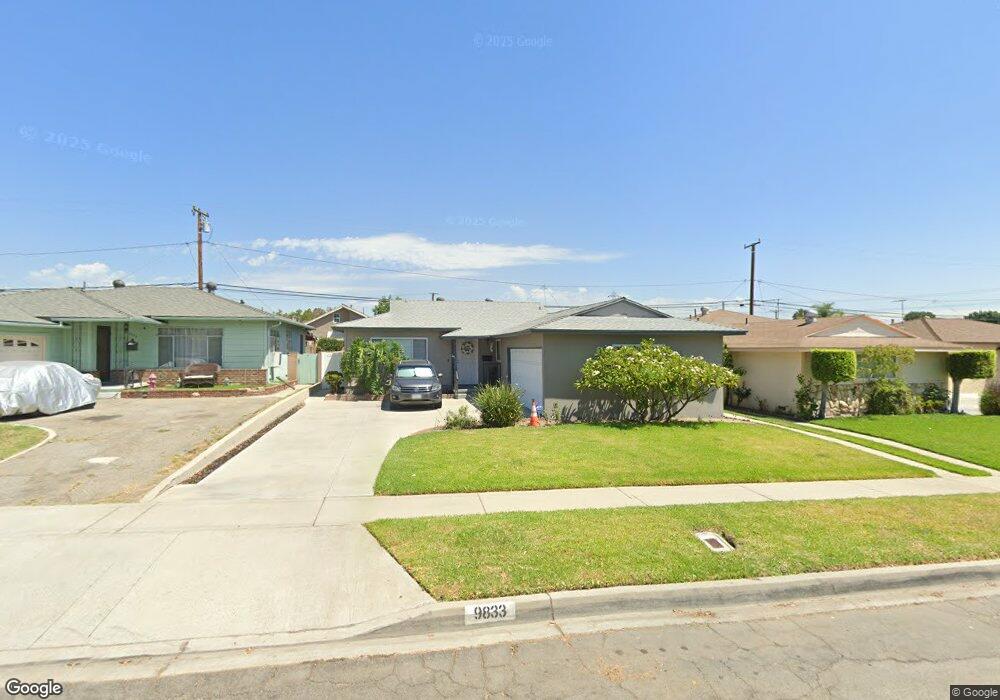
9833 Whiteland St Pico Rivera, CA 90660
Estimated Value: $699,000 - $735,000
3
Beds
1
Bath
1,149
Sq Ft
$624/Sq Ft
Est. Value
About This Home
This home is located at 9833 Whiteland St, Pico Rivera, CA 90660 and is currently estimated at $717,491, approximately $624 per square foot. 9833 Whiteland St is a home located in Los Angeles County with nearby schools including Birney Tech Academy, The STEAM Academy @ Burke, and El Rancho High School.
Ownership History
Date
Name
Owned For
Owner Type
Purchase Details
Closed on
Jun 7, 2025
Sold by
Marron Guillermo
Bought by
2023 Guillermo Jr & Leticia Marron Family Tru and Marron
Current Estimated Value
Home Financials for this Owner
Home Financials are based on the most recent Mortgage that was taken out on this home.
Original Mortgage
$409,000
Interest Rate
6.65%
Mortgage Type
VA
Purchase Details
Closed on
Apr 18, 2025
Sold by
Famil 2023 and Famil Leticia
Bought by
Marron Guillermo
Home Financials for this Owner
Home Financials are based on the most recent Mortgage that was taken out on this home.
Original Mortgage
$409,000
Interest Rate
6.65%
Mortgage Type
VA
Purchase Details
Closed on
Aug 19, 2023
Sold by
Marron Guillermo and Marron Leticia
Bought by
Marron Guillermo and Marron Leticia
Purchase Details
Closed on
Nov 15, 2010
Sold by
Esquivel Oscar and Estate Of Elisa C Esquivel
Bought by
Marron Guillermo and Marron Leticia
Home Financials for this Owner
Home Financials are based on the most recent Mortgage that was taken out on this home.
Original Mortgage
$320,230
Interest Rate
4.18%
Mortgage Type
VA
Create a Home Valuation Report for This Property
The Home Valuation Report is an in-depth analysis detailing your home's value as well as a comparison with similar homes in the area
Home Values in the Area
Average Home Value in this Area
Purchase History
| Date | Buyer | Sale Price | Title Company |
|---|---|---|---|
| 2023 Guillermo Jr & Leticia Marron Family Tru | -- | None Listed On Document | |
| Marron Guillermo | -- | Vylla Title | |
| Marron Guillermo | -- | None Listed On Document | |
| Marron Guillermo | $310,000 | Lawyers Title |
Source: Public Records
Mortgage History
| Date | Status | Borrower | Loan Amount |
|---|---|---|---|
| Previous Owner | Marron Guillermo | $409,000 | |
| Previous Owner | Marron Guillermo | $320,230 |
Source: Public Records
Tax History
| Year | Tax Paid | Tax Assessment Tax Assessment Total Assessment is a certain percentage of the fair market value that is determined by local assessors to be the total taxable value of land and additions on the property. | Land | Improvement |
|---|---|---|---|---|
| 2025 | $5,589 | $397,150 | $255,201 | $141,949 |
| 2024 | $5,589 | $389,364 | $250,198 | $139,166 |
| 2023 | $5,434 | $381,731 | $245,293 | $136,438 |
| 2022 | $5,189 | $374,247 | $240,484 | $133,763 |
| 2021 | $5,065 | $366,910 | $235,769 | $131,141 |
| 2019 | $5,035 | $356,029 | $228,777 | $127,252 |
| 2018 | $4,788 | $349,049 | $224,292 | $124,757 |
| 2016 | $4,321 | $335,497 | $215,584 | $119,913 |
| 2015 | $4,255 | $330,458 | $212,346 | $118,112 |
| 2014 | $4,200 | $323,986 | $208,187 | $115,799 |
Source: Public Records
Map
Nearby Homes
- 8844 True Ave
- 9734 Terradell St
- 9950 La Docena Ln
- 8320 Orange Ave
- 9636 Cedartree Rd
- 9822 Bartley Ave
- 9943 Cedardale Dr
- 8611 Eglise Ave
- 9910 Aspen Cir
- 9225 Sideview Dr
- 11523 Willins St
- 11502 Claymore St
- 8328 Buhman Ave
- 9649 Pioneer Blvd
- 9434 Pico Vista Rd
- 11554 Claymore St
- 11571 Telegraph Rd
- 9106 Danby Ave
- 9871 Alburtis Ave Unit 38
- 9834 Jersey Ave Unit 10
- 9829 Whiteland St
- 9839 Whiteland St
- 9823 Whiteland St
- 9843 Whiteland St
- 9838 Roma St
- 9834 Roma St
- 9844 Roma St
- 9828 Roma St
- 9849 Whiteland St
- 9819 Whiteland St
- 9848 Roma St
- 9834 Whiteland St
- 9828 Whiteland St
- 9822 Roma St
- 9840 Whiteland St
- 9824 Whiteland St
- 9854 Roma St
- 9846 Whiteland St
- 9813 Whiteland St
- 9853 Whiteland St
Your Personal Tour Guide
Ask me questions while you tour the home.