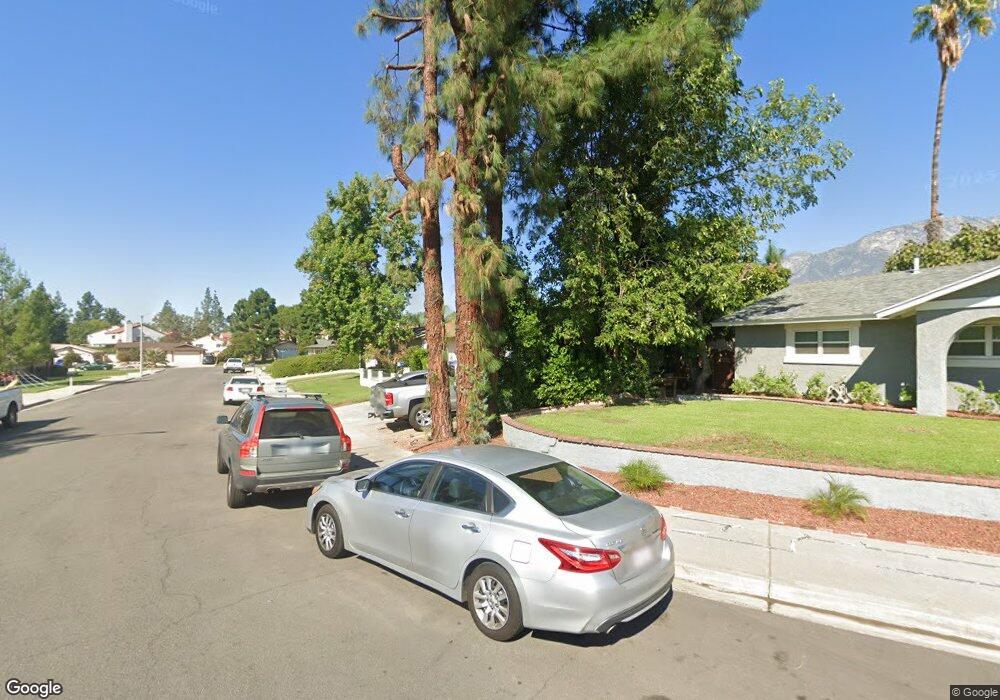
9836 Avalon St Rancho Cucamonga, CA 91701
Estimated Value: $706,141 - $804,000
4
Beds
2
Baths
1,512
Sq Ft
$506/Sq Ft
Est. Value
About This Home
This home is located at 9836 Avalon St, Rancho Cucamonga, CA 91701 and is currently estimated at $765,285, approximately $506 per square foot. 9836 Avalon St is a home located in San Bernardino County with nearby schools including Alta Loma Elementary, Alta Loma Junior High, and Alta Loma High.
Ownership History
Date
Name
Owned For
Owner Type
Purchase Details
Closed on
Oct 4, 2013
Sold by
Jensen Derek Bret and Jensen Derek
Bought by
Jensen Derek Bret and Jensen Karen Deanne
Current Estimated Value
Purchase Details
Closed on
Aug 11, 1998
Sold by
Jensen Karen
Bought by
Jensen Derek
Home Financials for this Owner
Home Financials are based on the most recent Mortgage that was taken out on this home.
Original Mortgage
$129,200
Outstanding Balance
$26,165
Interest Rate
6.88%
Estimated Equity
$739,120
Purchase Details
Closed on
Jul 23, 1998
Sold by
Reidenbaubh Mark E and Reidenbaubh Karen J
Bought by
Jensen Derek
Home Financials for this Owner
Home Financials are based on the most recent Mortgage that was taken out on this home.
Original Mortgage
$129,200
Outstanding Balance
$26,165
Interest Rate
6.88%
Estimated Equity
$739,120
Create a Home Valuation Report for This Property
The Home Valuation Report is an in-depth analysis detailing your home's value as well as a comparison with similar homes in the area
Home Values in the Area
Average Home Value in this Area
Purchase History
| Date | Buyer | Sale Price | Title Company |
|---|---|---|---|
| Jensen Derek Bret | -- | None Available | |
| Jensen Derek | -- | Fidelity National Title | |
| Jensen Derek | $136,000 | Fidelity National Title |
Source: Public Records
Mortgage History
| Date | Status | Borrower | Loan Amount |
|---|---|---|---|
| Open | Jensen Derek | $129,200 |
Source: Public Records
Tax History Compared to Growth
Tax History
| Year | Tax Paid | Tax Assessment Tax Assessment Total Assessment is a certain percentage of the fair market value that is determined by local assessors to be the total taxable value of land and additions on the property. | Land | Improvement |
|---|---|---|---|---|
| 2025 | $2,264 | $213,212 | $47,031 | $166,181 |
| 2024 | $2,264 | $209,032 | $46,109 | $162,923 |
| 2023 | $2,212 | $204,933 | $45,205 | $159,728 |
| 2022 | $2,205 | $200,915 | $44,319 | $156,596 |
| 2021 | $2,202 | $196,975 | $43,450 | $153,525 |
| 2020 | $2,112 | $194,955 | $43,004 | $151,951 |
| 2019 | $2,134 | $191,133 | $42,161 | $148,972 |
| 2018 | $2,086 | $187,385 | $41,334 | $146,051 |
| 2017 | $1,990 | $183,711 | $40,524 | $143,187 |
| 2016 | $1,935 | $180,108 | $39,729 | $140,379 |
| 2015 | $1,922 | $177,402 | $39,132 | $138,270 |
| 2014 | $1,867 | $173,926 | $38,365 | $135,561 |
Source: Public Records
Map
Nearby Homes
- 9740 Woodleaf Dr
- 6740 London Ave
- 6949 Laguna Place Unit B1
- 6931 Berkshire Ave
- 6765 Jadeite Ave
- 7018 Princeton Place
- 6946 Archibald Ave
- 6880 Archibald Ave Unit 114
- 6880 Archibald Ave Unit 27
- 6880 Archibald Ave Unit 40
- 10040 Jonquil Dr
- 10088 Goldenrod Ct
- 9800 Baseline Rd Unit 76
- 9800 Baseline Rd Unit 71
- 9800 Baseline Rd Unit 62
- 9757 Balaton St
- 6600 Montresor Place
- 6644 Brissac Place
- 6742 Meriwether Ct
- 10123 Finch Ave