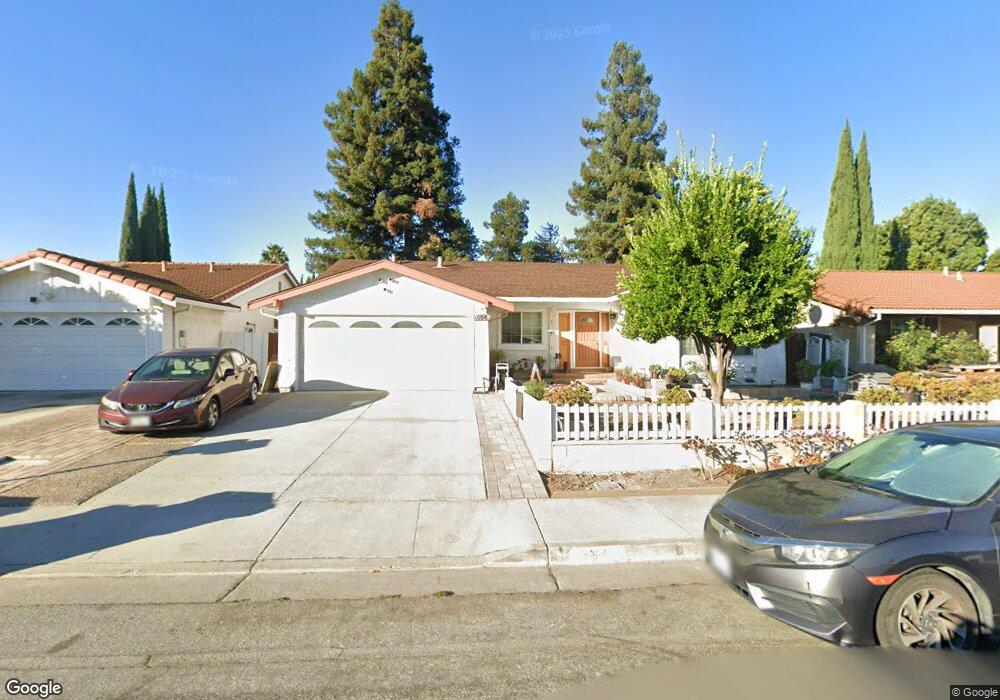
984 Junesong Way San Jose, CA 95133
Commodore NeighborhoodEstimated Value: $1,366,000 - $1,810,000
4
Beds
2
Baths
1,918
Sq Ft
$830/Sq Ft
Est. Value
About This Home
This home is located at 984 Junesong Way, San Jose, CA 95133 and is currently estimated at $1,592,640, approximately $830 per square foot. 984 Junesong Way is a home located in Santa Clara County with nearby schools including Vinci Park Elementary School, Piedmont Middle School, and Independence High School.
Ownership History
Date
Name
Owned For
Owner Type
Purchase Details
Closed on
Sep 25, 2019
Sold by
Marcos Miriam C
Bought by
Rlt Marcos Miriam C and Rlt Miriam Cabebe Marcos
Current Estimated Value
Purchase Details
Closed on
Feb 7, 2017
Sold by
Marcos Miriam C and Cabebe Jose C
Bought by
Marcos Miriam C
Home Financials for this Owner
Home Financials are based on the most recent Mortgage that was taken out on this home.
Original Mortgage
$180,000
Interest Rate
4.2%
Mortgage Type
New Conventional
Purchase Details
Closed on
Oct 21, 1999
Sold by
Cabebe Jose C and Cabebe Primitiva C
Bought by
Marcos Miriam C and Cabebe Jose C
Home Financials for this Owner
Home Financials are based on the most recent Mortgage that was taken out on this home.
Original Mortgage
$204,500
Interest Rate
7.84%
Create a Home Valuation Report for This Property
The Home Valuation Report is an in-depth analysis detailing your home's value as well as a comparison with similar homes in the area
Home Values in the Area
Average Home Value in this Area
Purchase History
| Date | Buyer | Sale Price | Title Company |
|---|---|---|---|
| Rlt Marcos Miriam C | -- | None Available | |
| Marcos Miriam C | $119,090 | Old Republic Title Company | |
| Marcos Miriam C | -- | Chicago Title | |
| Marcos Miriam C | -- | Chicago Title |
Source: Public Records
Mortgage History
| Date | Status | Borrower | Loan Amount |
|---|---|---|---|
| Previous Owner | Marcos Miriam C | $180,000 | |
| Previous Owner | Marcos Miriam C | $204,500 |
Source: Public Records
Tax History Compared to Growth
Tax History
| Year | Tax Paid | Tax Assessment Tax Assessment Total Assessment is a certain percentage of the fair market value that is determined by local assessors to be the total taxable value of land and additions on the property. | Land | Improvement |
|---|---|---|---|---|
| 2025 | $7,818 | $496,995 | $296,600 | $200,395 |
| 2024 | $7,818 | $451,957 | $290,785 | $161,172 |
| 2023 | $7,644 | $443,096 | $285,084 | $158,012 |
| 2022 | $7,585 | $434,409 | $279,495 | $154,914 |
| 2021 | $7,297 | $425,892 | $274,015 | $151,877 |
| 2020 | $6,993 | $421,526 | $271,206 | $150,320 |
| 2019 | $6,702 | $413,262 | $265,889 | $147,373 |
| 2018 | $6,584 | $405,160 | $260,676 | $144,484 |
| 2017 | $6,683 | $397,216 | $255,565 | $141,651 |
| 2016 | $6,346 | $389,428 | $250,554 | $138,874 |
| 2015 | $6,274 | $383,579 | $246,791 | $136,788 |
| 2014 | $5,350 | $376,066 | $241,957 | $134,109 |
Source: Public Records
Map
Nearby Homes
- 1049 Branbury Way
- 1713 Winston St
- 1146 Rosebriar Way
- 2044 Voss Park Ln
- 1957 Cape Horn Dr
- 1087 Yarrow Terrace
- 1660 Solari Place
- 1055 Thyme Walkway
- 12280 Mabury Rd
- 1945 Galileo Ln
- 1210 Briarcreek Ct
- 1137 Mallow Terrace
- 832 N Jackson Ave
- 1036 Onofrio Ln Unit 6
- 2324 Mossdale Way
- 2328 Mossdale Way
- 1538 Neleigh Place
- 2109 Kiwi Walkway
- 1233 Briarleaf Cir
- 1809 Sageland Dr
- 990 Junesong Way
- 978 Junesong Way
- 1756 Fanwood Ct
- 996 Junesong Way
- 972 Junesong Way
- 1750 Fanwood Ct
- 1755 Fanwood Ct
- 983 Junesong Way
- 1002 Junesong Way
- 989 Junesong Way
- 966 Junesong Way
- 1769 Cape Aston Ct
- 1746 Fanwood Ct
- 977 Junesong Way
- 1775 Cape Aston Ct
- 1751 Fanwood Ct
- 971 Junesong Way
- 1008 Junesong Way
- 965 Junesong Way
- 960 Junesong Way