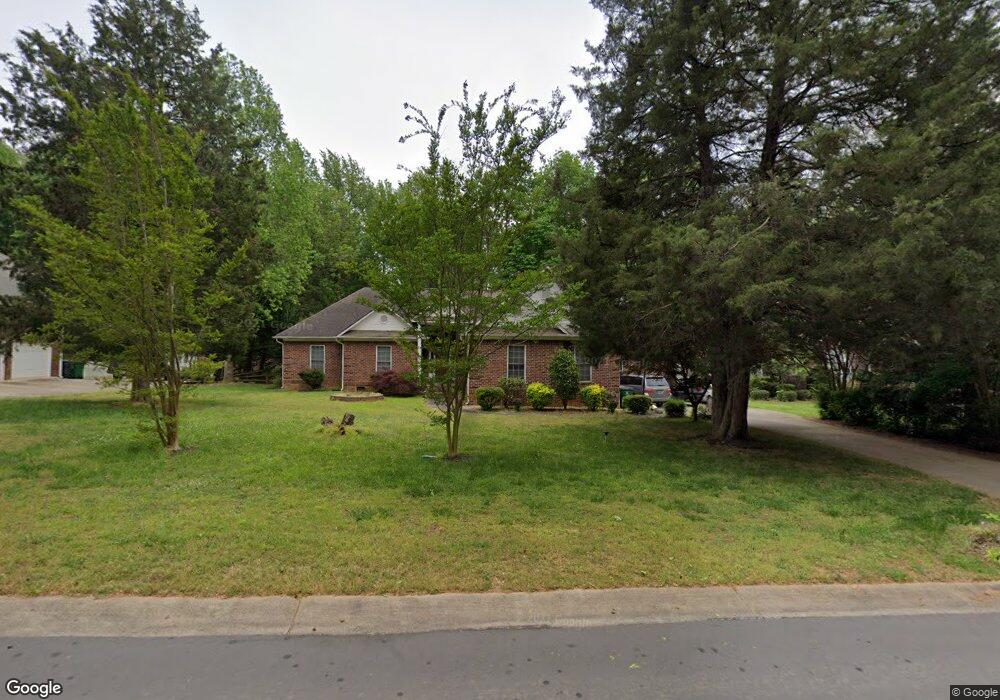
9840 Drawbridge Dr Charlotte, NC 28215
Silverwood NeighborhoodEstimated Value: $469,000 - $594,000
4
Beds
4
Baths
2,947
Sq Ft
$181/Sq Ft
Est. Value
About This Home
This home is located at 9840 Drawbridge Dr, Charlotte, NC 28215 and is currently estimated at $532,297, approximately $180 per square foot. 9840 Drawbridge Dr is a home located in Mecklenburg County with nearby schools including Reedy Creek Elementary School, Northridge Middle School, and Rocky River High School.
Ownership History
Date
Name
Owned For
Owner Type
Purchase Details
Closed on
Mar 4, 2016
Sold by
Rebh Jeffrey S and Rebh Cornelia M
Bought by
Lawton Roslyn B and Lawton James L
Current Estimated Value
Home Financials for this Owner
Home Financials are based on the most recent Mortgage that was taken out on this home.
Original Mortgage
$251,363
Outstanding Balance
$202,765
Interest Rate
4.24%
Mortgage Type
FHA
Estimated Equity
$329,532
Purchase Details
Closed on
Oct 15, 2007
Sold by
Fuentes Jose R and Carmen Fuentes D
Bought by
Rebh Jeffrey S
Home Financials for this Owner
Home Financials are based on the most recent Mortgage that was taken out on this home.
Original Mortgage
$203,400
Interest Rate
6.41%
Mortgage Type
Purchase Money Mortgage
Purchase Details
Closed on
Feb 19, 1998
Sold by
Helms Edna B
Bought by
Fuentes Jose R and Carmen Fuentes D
Create a Home Valuation Report for This Property
The Home Valuation Report is an in-depth analysis detailing your home's value as well as a comparison with similar homes in the area
Home Values in the Area
Average Home Value in this Area
Purchase History
| Date | Buyer | Sale Price | Title Company |
|---|---|---|---|
| Lawton Roslyn B | $256,000 | None Available | |
| Rebh Jeffrey S | $226,000 | None Available | |
| Fuentes Jose R | $27,500 | -- |
Source: Public Records
Mortgage History
| Date | Status | Borrower | Loan Amount |
|---|---|---|---|
| Open | Lawton Roslyn B | $251,363 | |
| Previous Owner | Rebh Jeffrey S | $203,400 |
Source: Public Records
Tax History Compared to Growth
Tax History
| Year | Tax Paid | Tax Assessment Tax Assessment Total Assessment is a certain percentage of the fair market value that is determined by local assessors to be the total taxable value of land and additions on the property. | Land | Improvement |
|---|---|---|---|---|
| 2025 | $3,583 | $452,900 | $70,000 | $382,900 |
| 2024 | $3,583 | $452,900 | $70,000 | $382,900 |
| 2023 | $3,461 | $452,900 | $70,000 | $382,900 |
| 2022 | $2,843 | $281,600 | $40,000 | $241,600 |
| 2021 | $2,832 | $281,600 | $40,000 | $241,600 |
| 2020 | $2,825 | $281,600 | $40,000 | $241,600 |
| 2019 | $2,809 | $281,600 | $40,000 | $241,600 |
| 2018 | $3,515 | $262,300 | $39,900 | $222,400 |
| 2017 | $3,458 | $262,300 | $39,900 | $222,400 |
| 2016 | $3,449 | $262,300 | $39,900 | $222,400 |
| 2015 | $3,437 | $262,300 | $39,900 | $222,400 |
| 2014 | $3,431 | $241,100 | $39,900 | $201,200 |
Source: Public Records
Map
Nearby Homes
- 9843 Drawbridge Dr
- 9922 Drawbridge Dr
- 8953 Bradstreet Commons Way
- 9036 Bradstreet Commons Way
- 1036 BraMcOte Ln
- 6007 Shortleaf Pine Ct
- 4115 Stockbrook Dr
- 11039 Palestrina Rd
- 7105 Lenton Rd
- 8239 Weeping Fig Ln
- 9132 Colwick Hill Ln
- 5436 Hughesdale Dr
- 9022 Colwick Hill Rd
- 8502 Mansell Ct
- 14038 Pinyon Pine Ln Unit 407
- 8432 Spirea Ct
- 9339 Bradstreet Commons Way Unit 25
- 8925 Harrisburg Rd
- 8608 Cedarbrook Dr
- 8516 Denbur Dr
- 9850 Drawbridge Dr
- 9832 Drawbridge Dr
- 9902 Drawbridge Dr
- 9824 Drawbridge Dr
- 9835 Drawbridge Dr
- 9901 Drawbridge Dr
- 9912 Drawbridge Dr
- 9825 Drawbridge Dr
- 9125 Castle Garden Ln
- 9911 Drawbridge Dr
- 9921 Drawbridge Dr
- 9205 Castle Garden Ln
- 9301 Castle Garden Ln
- 9116 Castle Garden Ln
- 9124 Castle Garden Ln
- 9311 Castle Garden Ln
- 10006 Drawbridge Dr
- 9832 Robinson Church Rd
- 9206 Castle Garden Ln
- 9800 Robinson Church Rd