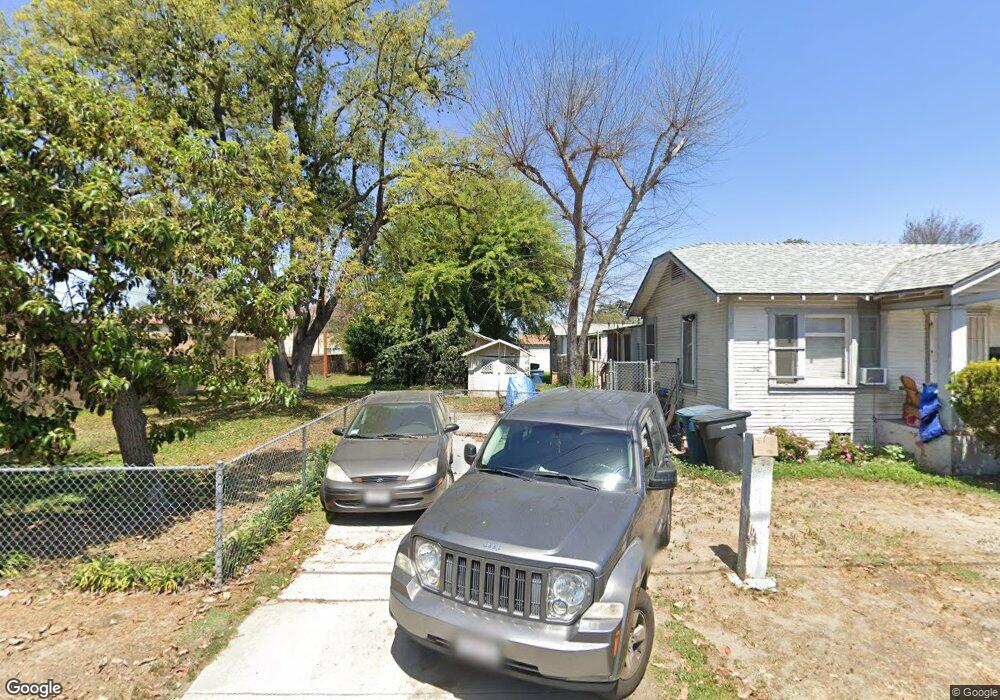
9841 Beach St Bellflower, CA 90706
Estimated Value: $758,000 - $1,387,000
2
Beds
2
Baths
976
Sq Ft
$983/Sq Ft
Est. Value
About This Home
This home is located at 9841 Beach St, Bellflower, CA 90706 and is currently estimated at $959,049, approximately $982 per square foot. 9841 Beach St is a home located in Los Angeles County with nearby schools including Thomas Jefferson Elementary School, Mayfair High School, and St. Bernard School.
Ownership History
Date
Name
Owned For
Owner Type
Purchase Details
Closed on
Feb 1, 2022
Sold by
Daniel A Rogers Family Trust
Bought by
Bear Flag Homes Llc
Current Estimated Value
Purchase Details
Closed on
Jan 31, 2017
Sold by
Oshita Robbin K and Estate Of Daniel Albert Rogers
Bought by
Oshita Robbin K and The Daniel A Rogers Family Tru
Purchase Details
Closed on
Oct 15, 2013
Sold by
Kuchinka John A and Kuchinka Charlene A
Bought by
Kuchinka John A and Kuchinka Charlene A
Purchase Details
Closed on
Feb 27, 2009
Sold by
Hardie Beverly Jean
Bought by
Hardie Beverly J and The Beverly J Hardie Family Tr
Purchase Details
Closed on
Nov 13, 1997
Sold by
Pike Mary
Bought by
Rogers Shirley Ann
Purchase Details
Closed on
Oct 30, 1997
Sold by
Rogers Shirley Ann
Bought by
Rogers Shirley Ann and Rogers Daniel Albert
Create a Home Valuation Report for This Property
The Home Valuation Report is an in-depth analysis detailing your home's value as well as a comparison with similar homes in the area
Home Values in the Area
Average Home Value in this Area
Purchase History
| Date | Buyer | Sale Price | Title Company |
|---|---|---|---|
| Bear Flag Homes Llc | $1,150,000 | Ticor Title | |
| Oshita Robbin K | -- | None Available | |
| Kuchinka John A | -- | None Available | |
| Hardie Beverly J | -- | None Available | |
| Rogers Shirley Ann | -- | -- | |
| Rogers Shirley Ann | -- | -- |
Source: Public Records
Tax History
| Year | Tax Paid | Tax Assessment Tax Assessment Total Assessment is a certain percentage of the fair market value that is determined by local assessors to be the total taxable value of land and additions on the property. | Land | Improvement |
|---|---|---|---|---|
| 2025 | $6,781 | $562,440 | $424,483 | $137,957 |
| 2024 | $6,781 | $551,412 | $416,160 | $135,252 |
| 2023 | $6,506 | $540,600 | $408,000 | $132,600 |
| 2022 | $2,046 | $133,587 | $30,829 | $102,758 |
| 2021 | $2,003 | $130,969 | $30,225 | $100,744 |
| 2020 | $1,986 | $129,627 | $29,916 | $99,711 |
| 2019 | $1,953 | $127,086 | $29,330 | $97,756 |
| 2018 | $1,902 | $124,595 | $28,755 | $95,840 |
| 2016 | $1,820 | $119,759 | $27,640 | $92,119 |
| 2015 | $1,786 | $117,961 | $27,225 | $90,736 |
| 2014 | $1,776 | $115,651 | $26,692 | $88,959 |
Source: Public Records
Map
Nearby Homes
- 9929 Park St
- 9725 Arkansas St
- 16924 Bixby Ave
- 10117 Palm St
- 16712 Bellflower Blvd
- 16919 Ardmore Ave
- 16822 Ardmore Ave
- 9559 Flower St
- 9545 Flower St
- 17013 California Ave
- 10241 Flora Vista St
- 16414 Cornuta Ave Unit 8
- 9921 Flora Vista St Unit 5
- 9921 Flora Vista St Unit 6
- 16331 Cornuta Ave Unit E
- 17046 Clark Ave
- 10292 Artesia Blvd
- 9601 Mayne St
- 10405 Park St
- 9520 Mayne St
Your Personal Tour Guide
Ask me questions while you tour the home.