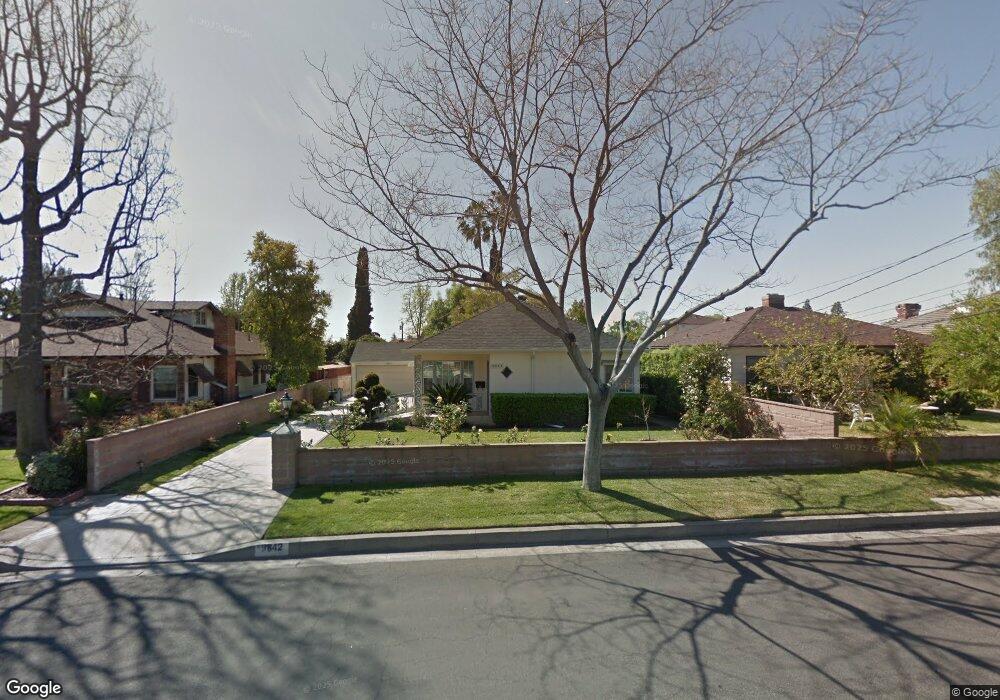
9842 Wendon St Temple City, CA 91780
Estimated Value: $1,307,000 - $1,497,000
3
Beds
2
Baths
1,966
Sq Ft
$711/Sq Ft
Est. Value
About This Home
This home is located at 9842 Wendon St, Temple City, CA 91780 and is currently estimated at $1,398,598, approximately $711 per square foot. 9842 Wendon St is a home located in Los Angeles County with nearby schools including Longden Elementary School, Oak Avenue Intermediate School, and Temple City High School.
Ownership History
Date
Name
Owned For
Owner Type
Purchase Details
Closed on
Apr 8, 2020
Sold by
Hanamoto Arthur I and Hanamoto Lynne K
Bought by
Hanamoto Arthur I and Hanamoto Lynne K
Current Estimated Value
Purchase Details
Closed on
May 9, 2005
Sold by
Hanamoto Art
Bought by
Hanamoto Lynne K
Purchase Details
Closed on
Mar 8, 2005
Sold by
Yuan Alyce Pei Jiun
Bought by
Hanamoto Arthur I and Hanamoto Lynne K
Home Financials for this Owner
Home Financials are based on the most recent Mortgage that was taken out on this home.
Original Mortgage
$250,000
Interest Rate
5.65%
Mortgage Type
Purchase Money Mortgage
Purchase Details
Closed on
Jul 12, 1999
Sold by
Freitag Mark J and Freitag Alice C
Bought by
Yuan Alyce Pei Jiun
Home Financials for this Owner
Home Financials are based on the most recent Mortgage that was taken out on this home.
Original Mortgage
$182,000
Interest Rate
7.64%
Create a Home Valuation Report for This Property
The Home Valuation Report is an in-depth analysis detailing your home's value as well as a comparison with similar homes in the area
Home Values in the Area
Average Home Value in this Area
Purchase History
| Date | Buyer | Sale Price | Title Company |
|---|---|---|---|
| Hanamoto Arthur I | -- | None Available | |
| Hanamoto Lynne K | -- | -- | |
| Hanamoto Arthur I | $638,000 | Southland Title | |
| Yuan Alyce Pei Jiun | $311,818 | Benefit Land Title Company |
Source: Public Records
Mortgage History
| Date | Status | Borrower | Loan Amount |
|---|---|---|---|
| Previous Owner | Hanamoto Arthur I | $250,000 | |
| Previous Owner | Yuan Alyce Pei Jiun | $182,000 |
Source: Public Records
Tax History Compared to Growth
Tax History
| Year | Tax Paid | Tax Assessment Tax Assessment Total Assessment is a certain percentage of the fair market value that is determined by local assessors to be the total taxable value of land and additions on the property. | Land | Improvement |
|---|---|---|---|---|
| 2025 | $10,484 | $889,300 | $616,379 | $272,921 |
| 2024 | $10,484 | $871,864 | $604,294 | $267,570 |
| 2023 | $10,247 | $854,770 | $592,446 | $262,324 |
| 2022 | $9,584 | $838,011 | $580,830 | $257,181 |
| 2021 | $9,764 | $821,581 | $569,442 | $252,139 |
| 2019 | $9,412 | $797,214 | $552,553 | $244,661 |
| 2018 | $9,190 | $781,583 | $541,719 | $239,864 |
| 2017 | $9,018 | $766,259 | $531,098 | $235,161 |
| 2016 | $8,807 | $751,235 | $520,685 | $230,550 |
| 2015 | $8,658 | $739,951 | $512,864 | $227,087 |
| 2014 | $8,278 | $703,000 | $487,000 | $216,000 |
Source: Public Records
Map
Nearby Homes
- 9711 Garibaldi Ave
- 9665 Longden Ave
- 6022 Rowland Ave
- 639 W Longden Ave
- 6119 Temple City Blvd
- 9861 E Lemon Ave
- 2015 Bella Vista Ave
- 5819 Baldwin Ave Unit C
- 662 W Norman Ave
- 6204 Oak Ave
- 1522 S Baldwin Ave Unit 15
- 1611 Lovell Ave
- 9618 E Camino Real Ave
- 6037 Oak Ave
- 2236 Holly Ave
- 5929 Oak Ave
- 631 W Camino Real Ave
- 382 W Woodruff Ave
- 1430 Lovell Ave
- 537 W Camino Real Ave
- 9848 Wendon St
- 9836 Wendon St
- 9854 Wendon St
- 9830 Wendon St
- 9843 Flaherty St
- 9837 Flaherty St
- 9849 Flaherty St
- 9831 Flaherty St
- 9824 Wendon St
- 9860 Wendon St
- 9855 Flaherty St
- 9843 Wendon St
- 9837 Wendon St
- 9849 Wendon St
- 6206 Golden West Ave
- 9831 Wendon St
- 9855 Wendon St
- 9861 Flaherty St
- 9818 Wendon St
- 9866 Wendon St