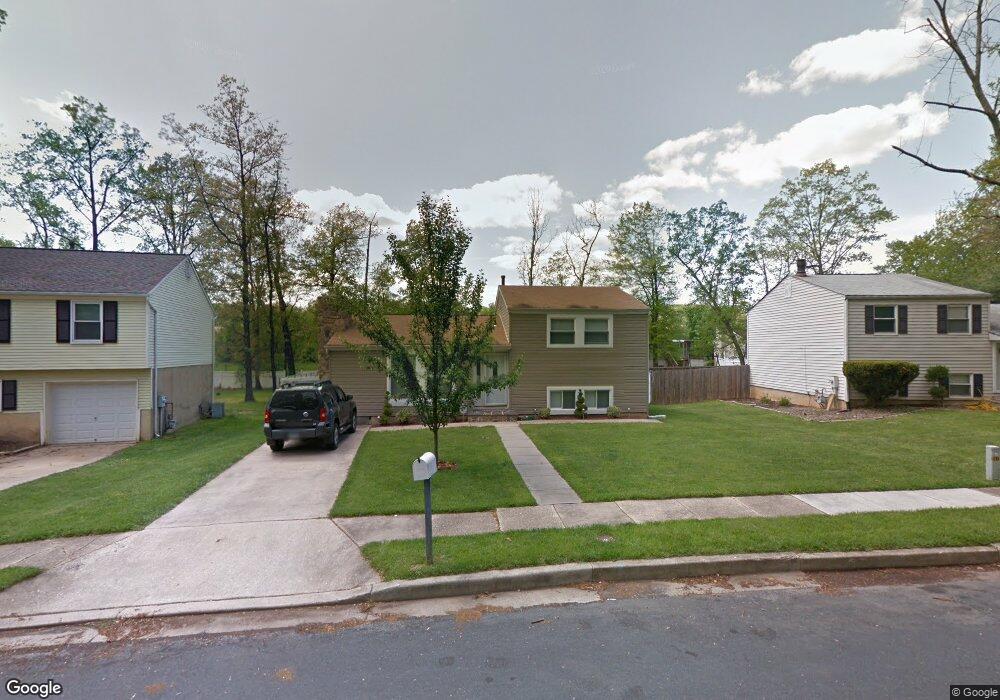
9845 Branchleigh Rd Randallstown, MD 21133
Estimated Value: $346,000 - $405,000
3
Beds
2
Baths
1,593
Sq Ft
$233/Sq Ft
Est. Value
About This Home
This home is located at 9845 Branchleigh Rd, Randallstown, MD 21133 and is currently estimated at $371,884, approximately $233 per square foot. 9845 Branchleigh Rd is a home located in Baltimore County with nearby schools including Deer Park Elementary School, Deer Park Middle Magnet School, and New Town High.
Ownership History
Date
Name
Owned For
Owner Type
Purchase Details
Closed on
Feb 4, 2010
Sold by
Couther Johnnie Mae
Bought by
Leftwich Quanda
Current Estimated Value
Purchase Details
Closed on
May 1, 2006
Sold by
Glaize Gwendolyn P
Bought by
Couther Johnnie Mae and Mccorkle Brian
Home Financials for this Owner
Home Financials are based on the most recent Mortgage that was taken out on this home.
Original Mortgage
$184,440
Interest Rate
6.55%
Mortgage Type
Purchase Money Mortgage
Purchase Details
Closed on
Aug 19, 1987
Sold by
Rawlings Marilyn Manuela
Bought by
Glaize Gwendolyn P
Create a Home Valuation Report for This Property
The Home Valuation Report is an in-depth analysis detailing your home's value as well as a comparison with similar homes in the area
Home Values in the Area
Average Home Value in this Area
Purchase History
| Date | Buyer | Sale Price | Title Company |
|---|---|---|---|
| Leftwich Quanda | $196,000 | -- | |
| Couther Johnnie Mae | $230,550 | -- | |
| Glaize Gwendolyn P | $85,000 | -- |
Source: Public Records
Mortgage History
| Date | Status | Borrower | Loan Amount |
|---|---|---|---|
| Previous Owner | Couther Johnnie Mae | $184,440 | |
| Previous Owner | Couther Johnnie Mae | $46,110 |
Source: Public Records
Tax History Compared to Growth
Tax History
| Year | Tax Paid | Tax Assessment Tax Assessment Total Assessment is a certain percentage of the fair market value that is determined by local assessors to be the total taxable value of land and additions on the property. | Land | Improvement |
|---|---|---|---|---|
| 2025 | $3,414 | $240,367 | -- | -- |
| 2024 | $3,414 | $214,100 | $79,000 | $135,100 |
| 2023 | $1,647 | $206,867 | $0 | $0 |
| 2022 | $3,115 | $199,633 | $0 | $0 |
| 2021 | $3,109 | $192,400 | $79,000 | $113,400 |
| 2020 | $3,109 | $188,267 | $0 | $0 |
| 2019 | $2,959 | $184,133 | $0 | $0 |
| 2018 | $2,995 | $180,000 | $62,400 | $117,600 |
| 2017 | $2,813 | $172,800 | $0 | $0 |
| 2016 | $2,589 | $165,600 | $0 | $0 |
| 2015 | $2,589 | $158,400 | $0 | $0 |
| 2014 | $2,589 | $158,400 | $0 | $0 |
Source: Public Records
Map
Nearby Homes
- 9931 Tuscarora Rd
- 9 Bannock Ct
- 3827 Rayton Rd
- 4264 Cayuga Rd
- 3903 Innerdale Ct
- 3803 Marriottsville Rd
- 3903 Red Deer Cir
- 4105 Hanwell Rd
- 30 Sheraton Rd
- 9519 Branchleigh Rd
- 4108 Brown Bark Cir
- 9804 Marriottsville Rd
- 9401 Summer Squal Dr
- 9530 John Locke Way
- 9406 Painted Tree Dr
- 3538 Corn Stream Rd
- 9500 Georgian Way
- 9302 Silver Charm Dr
- 9613 Watts Rd
- 3517 Kings Point Rd
- 9843 Branchleigh Rd
- 4101 Marriottsville Rd
- 4103 Marriottsville Rd
- 9847 Branchleigh Rd
- 9849 Branchleigh Rd
- 9839 Branchleigh Rd
- 9841 Branchleigh Rd
- 4105 Marriottsville Rd
- 9840 Branchleigh Rd
- 9842 Branchleigh Rd
- 9851 Branchleigh Rd
- 9838 Branchleigh Rd
- 9844 Branchleigh Rd
- 4107 Marriottsville Rd
- 9836 Branchleigh Rd
- 9846 Branchleigh Rd
- 9837 Branchleigh Rd
- 4109 Marriottsville Rd
- 9834 Branchleigh Rd
- 9848 Branchleigh Rd