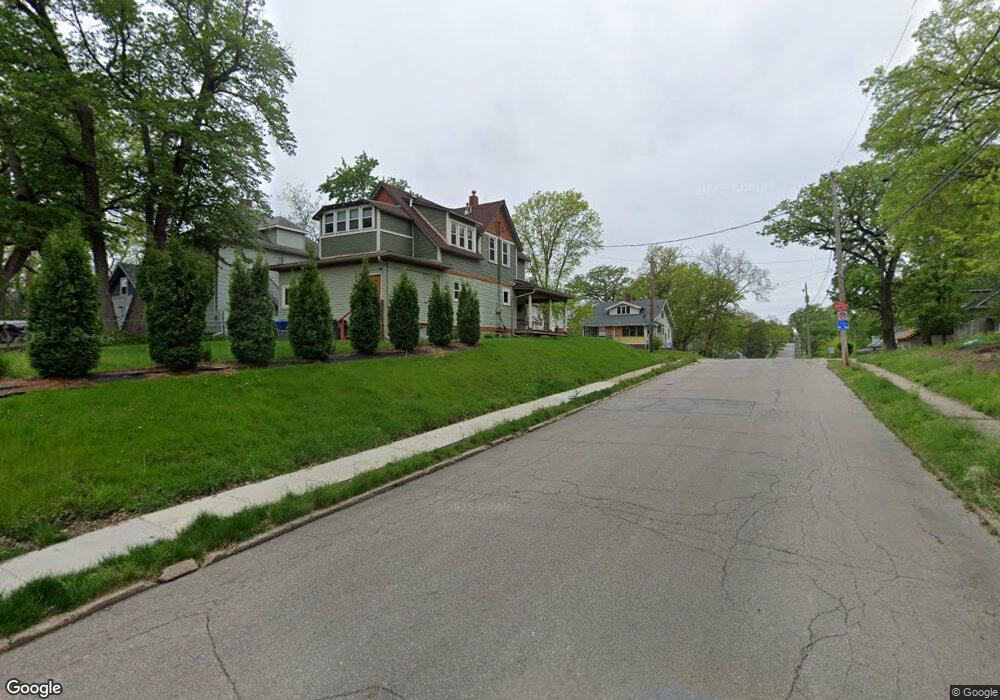
985 26th St Des Moines, IA 50312
Drake NeighborhoodEstimated Value: $129,000
4
Beds
3
Baths
1,628
Sq Ft
$79/Sq Ft
Est. Value
About This Home
This home is located at 985 26th St, Des Moines, IA 50312 and is currently estimated at $129,000, approximately $79 per square foot. 985 26th St is a home located in Polk County with nearby schools including Callanan Middle School and Roosevelt High School.
Ownership History
Date
Name
Owned For
Owner Type
Purchase Details
Closed on
Aug 5, 2015
Sold by
Leporte Donald C and Leporte Marjorie L
Bought by
Bluesteel Investments Llc
Current Estimated Value
Purchase Details
Closed on
Jun 1, 2010
Sold by
Leporte Donald C and Leporte Marjorie L
Bought by
Bluesteel Investments Llc
Home Financials for this Owner
Home Financials are based on the most recent Mortgage that was taken out on this home.
Original Mortgage
$54,049
Interest Rate
6%
Mortgage Type
Seller Take Back
Purchase Details
Closed on
Jun 12, 1999
Sold by
Leporte Donald C and Leporte Marjorie L
Bought by
Mcaninch Properties Llc
Home Financials for this Owner
Home Financials are based on the most recent Mortgage that was taken out on this home.
Original Mortgage
$60,000
Interest Rate
9%
Mortgage Type
Seller Take Back
Create a Home Valuation Report for This Property
The Home Valuation Report is an in-depth analysis detailing your home's value as well as a comparison with similar homes in the area
Home Values in the Area
Average Home Value in this Area
Purchase History
| Date | Buyer | Sale Price | Title Company |
|---|---|---|---|
| Bluesteel Investments Llc | $65,000 | Attorney | |
| Bluesteel Investments Llc | $65,000 | None Available | |
| Donald C & Marjorie L Leporte Family Tru | -- | None Available | |
| Mcaninch Properties Llc | $62,000 | -- |
Source: Public Records
Mortgage History
| Date | Status | Borrower | Loan Amount |
|---|---|---|---|
| Previous Owner | Bluesteel Investments Llc | $54,049 | |
| Previous Owner | Mcaninch Properties Llc | $60,000 |
Source: Public Records
Tax History
| Year | Tax Paid | Tax Assessment Tax Assessment Total Assessment is a certain percentage of the fair market value that is determined by local assessors to be the total taxable value of land and additions on the property. | Land | Improvement |
|---|---|---|---|---|
| 2025 | $2,644 | $155,200 | $29,500 | $125,700 |
| 2024 | $2,644 | $134,400 | $25,500 | $108,900 |
| 2023 | $2,444 | $134,400 | $25,500 | $108,900 |
| 2022 | $2,426 | $103,700 | $20,500 | $83,200 |
| 2021 | $2,270 | $103,700 | $20,500 | $83,200 |
| 2020 | $2,360 | $91,000 | $18,200 | $72,800 |
| 2019 | $2,288 | $91,000 | $18,200 | $72,800 |
| 2018 | $2,264 | $85,100 | $12,000 | $73,100 |
| 2017 | $2,082 | $85,100 | $12,000 | $73,100 |
| 2016 | $2,030 | $77,000 | $10,800 | $66,200 |
| 2015 | $2,030 | $77,000 | $10,800 | $66,200 |
| 2014 | $1,918 | $72,200 | $10,100 | $62,100 |
Source: Public Records
Map
Nearby Homes
Your Personal Tour Guide
Ask me questions while you tour the home.