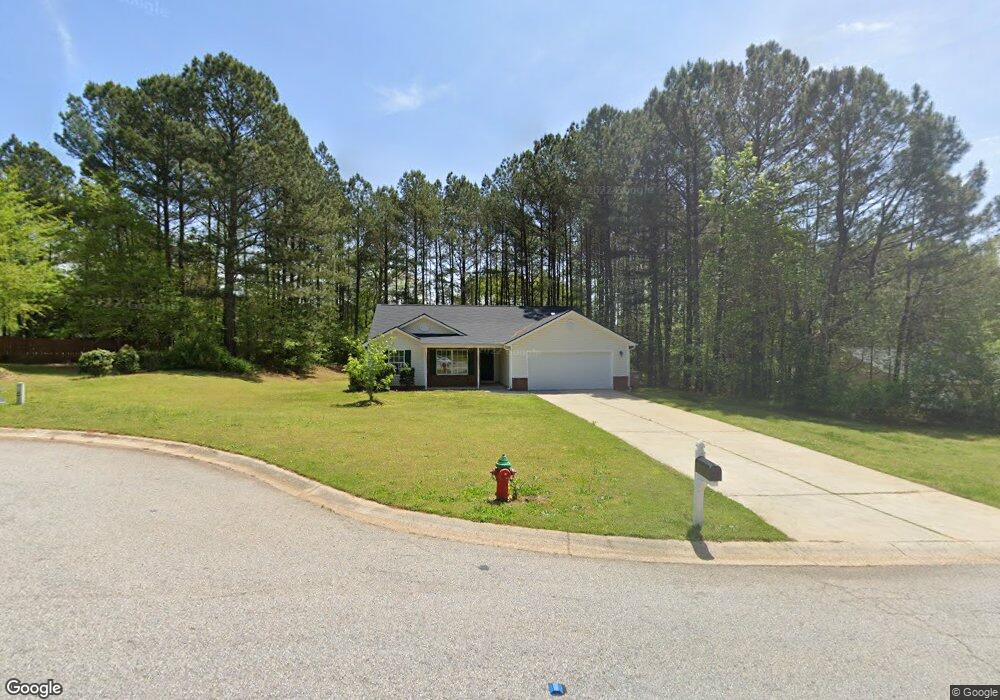
985 Camellia Ct Unit 10C Bethlehem, GA 30620
Estimated Value: $280,000 - $326,609
3
Beds
2
Baths
1,306
Sq Ft
$234/Sq Ft
Est. Value
About This Home
This home is located at 985 Camellia Ct Unit 10C, Bethlehem, GA 30620 and is currently estimated at $306,152, approximately $234 per square foot. 985 Camellia Ct Unit 10C is a home located in Barrow County with nearby schools including Yargo Elementary School, Haymon-Morris Middle School, and Apalachee High School.
Ownership History
Date
Name
Owned For
Owner Type
Purchase Details
Closed on
Sep 30, 2021
Sold by
Lindell Trevia R
Bought by
Craig Evan L
Current Estimated Value
Purchase Details
Closed on
Aug 24, 2012
Sold by
Jpmorgan Chase Bank Na
Bought by
Lindell Bruce A and Lindell Trevia R
Purchase Details
Closed on
Aug 23, 2012
Sold by
Jp Morgan Chase Bank Na
Bought by
And Lindell Bruce A
Purchase Details
Closed on
Feb 7, 2012
Sold by
Whitlatch Karen D
Bought by
Jpmorgan Chase Bank Na
Purchase Details
Closed on
Aug 1, 2003
Sold by
Star Hm Builders Inc
Bought by
Whitlatch Karen D
Home Financials for this Owner
Home Financials are based on the most recent Mortgage that was taken out on this home.
Original Mortgage
$114,900
Interest Rate
6.13%
Mortgage Type
New Conventional
Purchase Details
Closed on
Jun 12, 2003
Sold by
Parkview Development Inc
Bought by
Star Home Builders Inc
Home Financials for this Owner
Home Financials are based on the most recent Mortgage that was taken out on this home.
Original Mortgage
$114,900
Interest Rate
6.13%
Mortgage Type
New Conventional
Purchase Details
Closed on
May 2, 2000
Bought by
Parkview Development Inc
Create a Home Valuation Report for This Property
The Home Valuation Report is an in-depth analysis detailing your home's value as well as a comparison with similar homes in the area
Home Values in the Area
Average Home Value in this Area
Purchase History
| Date | Buyer | Sale Price | Title Company |
|---|---|---|---|
| Craig Evan L | $250,000 | -- | |
| Lindell Bruce A | $71,255 | -- | |
| And Lindell Bruce A | $71,300 | -- | |
| Jpmorgan Chase Bank Na | $63,750 | -- | |
| Whitlatch Karen D | $114,900 | -- | |
| Star Home Builders Inc | $120,000 | -- | |
| Parkview Development Inc | -- | -- |
Source: Public Records
Mortgage History
| Date | Status | Borrower | Loan Amount |
|---|---|---|---|
| Previous Owner | Whitlatch Karen D | $114,900 |
Source: Public Records
Tax History Compared to Growth
Tax History
| Year | Tax Paid | Tax Assessment Tax Assessment Total Assessment is a certain percentage of the fair market value that is determined by local assessors to be the total taxable value of land and additions on the property. | Land | Improvement |
|---|---|---|---|---|
| 2024 | $3,006 | $119,245 | $25,200 | $94,045 |
| 2023 | $3,011 | $119,845 | $25,200 | $94,645 |
| 2022 | $2,781 | $95,088 | $20,000 | $75,088 |
| 2021 | $1,970 | $62,457 | $16,000 | $46,457 |
| 2020 | $1,762 | $55,380 | $16,000 | $39,380 |
| 2019 | $1,792 | $55,380 | $16,000 | $39,380 |
| 2018 | $1,686 | $52,580 | $13,200 | $39,380 |
| 2017 | $1,316 | $45,202 | $13,200 | $32,002 |
| 2016 | $1,331 | $41,354 | $13,200 | $28,154 |
| 2015 | $1,346 | $41,664 | $13,200 | $28,464 |
| 2014 | $1,189 | $35,242 | $6,468 | $28,774 |
| 2013 | -- | $33,845 | $6,468 | $27,377 |
Source: Public Records
Map
Nearby Homes
- 0 Jb Owens Unit 7552902
- 0 Jb Owens Unit 7552891
- 0 Jb Owens Unit LOT 2 - 2.09 ACRES
- 0 Jb Owens Unit LOT 3 - 2.01 ACRES
- 303 Ron Dr
- 190 Lokeys Ln
- 637 Sleeping Meadow Ln
- 0 Tanners Bridge Rd Unit 10588144
- 763 Moss Side Dr
- 209 Angie Way
- 286 Meadows Dr
- 1129 Loganville Hwy
- 758 Clarence Edwards Rd
- 1071 Covenant Ct
- 1111 Otis Dr
- 103 Camp Ct
- 384 Winslow Ct
- 1024 Lyndhurst Ln
- 1164 Otis Dr
- 934 Beaver Hill Dr
- 985 Camellia Ct
- 983 Camellia Ct Unit 3
- 987 Camellia Ct
- 1167 Locust Dr Unit 5C
- 1167 Locust Dr Unit 3
- 1165 Locust Dr Unit 4C
- 1165 Locust Dr
- 981 Camellia Ct Unit 8C
- 981 Camellia Ct
- 0 Camellia Ct Unit 3221335
- 1169 Locust Dr Unit 3
- 1161 Locust Dr Unit 3C
- 1161 Locust Dr
- 986 Camellia Ct Unit 12C
- 986 Camellia Ct
- 982 Camellia Ct
- 982 Camellia Ct Unit 3
- 111 Trail Winds Dr
- 56 Hargrave Ave
- 40 Hargrave Ave