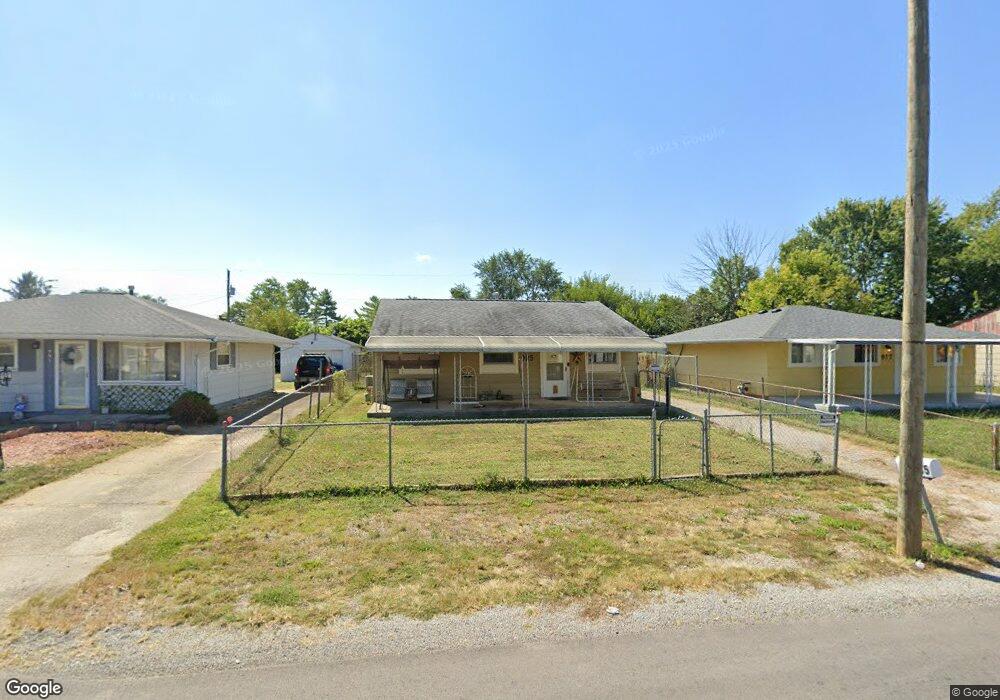
985 Hilock Rd Columbus, OH 43207
Obetz-Lockbourne NeighborhoodEstimated Value: $146,000 - $208,000
3
Beds
1
Bath
896
Sq Ft
$192/Sq Ft
Est. Value
About This Home
This home is located at 985 Hilock Rd, Columbus, OH 43207 and is currently estimated at $172,451, approximately $192 per square foot. 985 Hilock Rd is a home located in Franklin County with nearby schools including Parsons Elementary School, Buckeye Middle School, and Marion-Franklin High School.
Ownership History
Date
Name
Owned For
Owner Type
Purchase Details
Closed on
Feb 25, 2005
Sold by
Endicott Zetta M
Bought by
Endicott Howard T
Current Estimated Value
Purchase Details
Closed on
Jun 17, 2003
Sold by
Endicott Howard T and Endicott Zetta M
Bought by
Endicott Howard T and Endicott Zetta M
Purchase Details
Closed on
Feb 5, 2003
Sold by
Equicredit Corp Of America
Bought by
Fv-I Inc
Purchase Details
Closed on
Jan 31, 2003
Sold by
Longest John C and 985 Hilock Land Trust
Bought by
Endicott Zetta M
Purchase Details
Closed on
Jan 27, 2003
Sold by
Fv-1 Inc
Bought by
985 Hilock Land Trust
Purchase Details
Closed on
Jan 31, 2002
Sold by
Snyder Ronald W and Case #00Cve05 3850
Bought by
Equicredit Corp Of Ohio
Purchase Details
Closed on
Nov 17, 1997
Sold by
Snyder Mary and Snyder Ronald W
Bought by
Snyder Ronald W and Snyder Mary
Purchase Details
Closed on
Jun 5, 1991
Create a Home Valuation Report for This Property
The Home Valuation Report is an in-depth analysis detailing your home's value as well as a comparison with similar homes in the area
Home Values in the Area
Average Home Value in this Area
Purchase History
| Date | Buyer | Sale Price | Title Company |
|---|---|---|---|
| Endicott Howard T | -- | -- | |
| Endicott Howard T | -- | -- | |
| Fv-I Inc | $40,000 | Title First Agency Inc | |
| Endicott Zetta M | $49,900 | -- | |
| 985 Hilock Land Trust | $40,000 | Title First Agency Inc | |
| Equicredit Corp Of Ohio | $38,600 | -- | |
| Snyder Ronald W | -- | -- | |
| -- | -- | -- |
Source: Public Records
Tax History Compared to Growth
Tax History
| Year | Tax Paid | Tax Assessment Tax Assessment Total Assessment is a certain percentage of the fair market value that is determined by local assessors to be the total taxable value of land and additions on the property. | Land | Improvement |
|---|---|---|---|---|
| 2024 | $2,877 | $53,660 | $16,240 | $37,420 |
| 2023 | $1,875 | $53,655 | $16,240 | $37,415 |
| 2022 | $869 | $26,460 | $8,680 | $17,780 |
| 2021 | $872 | $26,460 | $8,680 | $17,780 |
| 2020 | $874 | $26,460 | $8,680 | $17,780 |
| 2019 | $875 | $23,170 | $7,560 | $15,610 |
| 2018 | $875 | $23,170 | $7,560 | $15,610 |
| 2017 | $874 | $23,170 | $7,560 | $15,610 |
| 2016 | $965 | $23,320 | $4,310 | $19,010 |
| 2015 | $876 | $23,320 | $4,310 | $19,010 |
| 2014 | $878 | $23,320 | $4,310 | $19,010 |
| 2013 | $469 | $24,535 | $4,515 | $20,020 |
Source: Public Records
Map
Nearby Homes
- 1138 Hilock Rd Unit 35
- 884 Bruckner Rd
- 1124 Rumsey Rd
- 860 Basswood Rd
- 3302 Hilock Place
- 780 Basswood Rd
- 1085 Williams Rd
- 1292 Moundview Ave
- 0 Williams Rd
- 696 Williams Rd
- 1118 Maplewood Rd
- 3551 Groveport Rd
- 3573 S Champion Ave
- 1382 Southfield Dr S
- 1068 Tobi Dr
- 1633-1635 E Greenway Ave
- 1450 Felix Dr
- 3018 Woodway Rd
- 3369 Norwalk Rd
- 3060 Durham Dr
- 991 Hilock Rd
- 977 Hilock Rd
- 999 Hilock Rd
- 971 Hilock Rd
- 982 Bruckner Rd
- 990 Bruckner Rd
- 976 Bruckner Rd
- 1005 Hilock Rd
- 996 Bruckner Rd
- 1004 Bruckner Rd
- 964 Bruckner Rd
- 959 Hilock Rd
- 1138 Hilock Rd
- 1011 Hilock Rd
- 1010 Bruckner Rd
- 956 Bruckner Rd
- 951 Hilock Rd
- 1982 Hilock Rd
- 950 Bruckner Rd
- 1020 Bruckner Rd