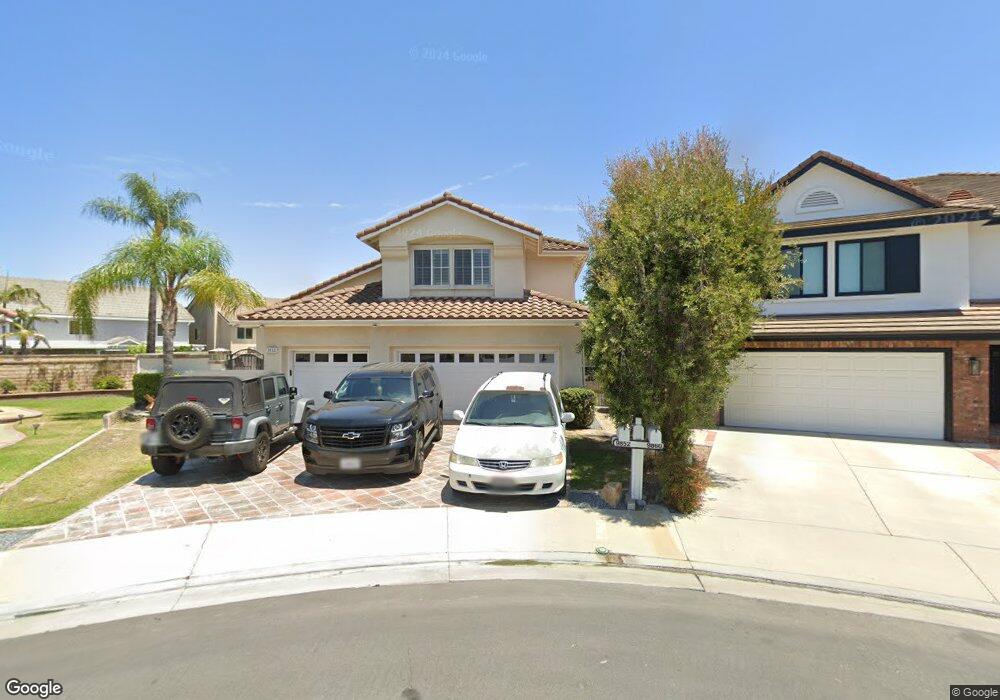
9852 Anzio Ct Cypress, CA 90630
Estimated Value: $1,719,645 - $2,104,000
4
Beds
3
Baths
2,614
Sq Ft
$711/Sq Ft
Est. Value
About This Home
This home is located at 9852 Anzio Ct, Cypress, CA 90630 and is currently estimated at $1,858,911, approximately $711 per square foot. 9852 Anzio Ct is a home located in Orange County with nearby schools including Margaret Landell Elementary School, A.E. Arnold Elementary School, and Lexington Junior High School.
Ownership History
Date
Name
Owned For
Owner Type
Purchase Details
Closed on
Feb 27, 2006
Sold by
Tengan Myles S and Tengan Joan J
Bought by
Tengan Myles S and Tengan Joan J
Current Estimated Value
Purchase Details
Closed on
May 30, 2003
Sold by
Sawyer Jeffrey Scott and Sawyer Michele R
Bought by
Tengan Myles S and Tengan Joan J
Home Financials for this Owner
Home Financials are based on the most recent Mortgage that was taken out on this home.
Original Mortgage
$320,000
Outstanding Balance
$135,998
Interest Rate
5.37%
Mortgage Type
Purchase Money Mortgage
Estimated Equity
$1,722,913
Purchase Details
Closed on
Feb 28, 1996
Sold by
Cypress Homes Inc
Bought by
Sawyer Jeffrey Scott and Sawyer Michele R
Home Financials for this Owner
Home Financials are based on the most recent Mortgage that was taken out on this home.
Original Mortgage
$305,200
Interest Rate
7.88%
Create a Home Valuation Report for This Property
The Home Valuation Report is an in-depth analysis detailing your home's value as well as a comparison with similar homes in the area
Home Values in the Area
Average Home Value in this Area
Purchase History
| Date | Buyer | Sale Price | Title Company |
|---|---|---|---|
| Tengan Myles S | -- | None Available | |
| Tengan Myles S | $730,000 | Commonwealth Land Title | |
| Sawyer Jeffrey Scott | $382,000 | First American Title Ins |
Source: Public Records
Mortgage History
| Date | Status | Borrower | Loan Amount |
|---|---|---|---|
| Open | Tengan Myles S | $320,000 | |
| Previous Owner | Sawyer Jeffrey Scott | $305,200 |
Source: Public Records
Tax History
| Year | Tax Paid | Tax Assessment Tax Assessment Total Assessment is a certain percentage of the fair market value that is determined by local assessors to be the total taxable value of land and additions on the property. | Land | Improvement |
|---|---|---|---|---|
| 2025 | $12,183 | $1,114,770 | $680,253 | $434,517 |
| 2024 | $12,183 | $1,092,912 | $666,914 | $425,998 |
| 2023 | $11,908 | $1,071,483 | $653,837 | $417,646 |
| 2022 | $11,777 | $1,050,474 | $641,017 | $409,457 |
| 2021 | $11,622 | $1,029,877 | $628,448 | $401,429 |
| 2020 | $11,579 | $1,019,317 | $622,004 | $397,313 |
| 2019 | $11,243 | $999,331 | $609,808 | $389,523 |
| 2018 | $11,091 | $979,737 | $597,851 | $381,886 |
| 2017 | $10,702 | $960,527 | $586,128 | $374,399 |
| 2016 | $10,329 | $915,755 | $574,636 | $341,119 |
| 2015 | $10,257 | $902,000 | $571,189 | $330,811 |
| 2014 | $10,464 | $835,000 | $504,189 | $330,811 |
Source: Public Records
Map
Nearby Homes
- 4644 Portofino Cir
- 4449 Avenida Granada
- 4790 Montefino Dr
- 4385 Larwin Ave
- 9598 Naples Dr
- 5068 Cumberland Dr
- 4305 Larwin Ave
- 10292 Ethel St
- 4238 Via Largo
- 4183 Elizabeth Ct
- 4194 Paseo de Oro
- 5000 Clementine Ln
- 4147 Elizabeth Ct
- 6007 Clementine Ln Unit 21
- 9011 Cerise Ln Unit 129
- 9001 Cerise Ln Unit 109
- 9001 Cerise Ln Unit 113
- 4200 Via Norte
- 9220 Whitney Way
- 10232 Hialeah Dr
- 9848 Anzio Ct
- 9860 Anzio Ct
- 4700 Tuscani Dr
- 4692 Tuscani Dr
- 4684 Tuscani Dr
- 9840 Anzio Ct
- 9868 Anzio Ct
- 4676 Tuscani Dr
- 4683 Ambruzzi Dr
- 9837 Fonte Rd
- 9876 Carrara Cir
- 9884 Carrara Cir
- 4668 Tuscani Dr
- 9824 Carrara Cir
- 9832 Carrara Cir
- 9892 Carrara Cir
- 4693 Ambruzzi Dr
- 9816 Carrara Cir
- 9900 Carrara Cir
- 9827 Fonte Rd
Your Personal Tour Guide
Ask me questions while you tour the home.