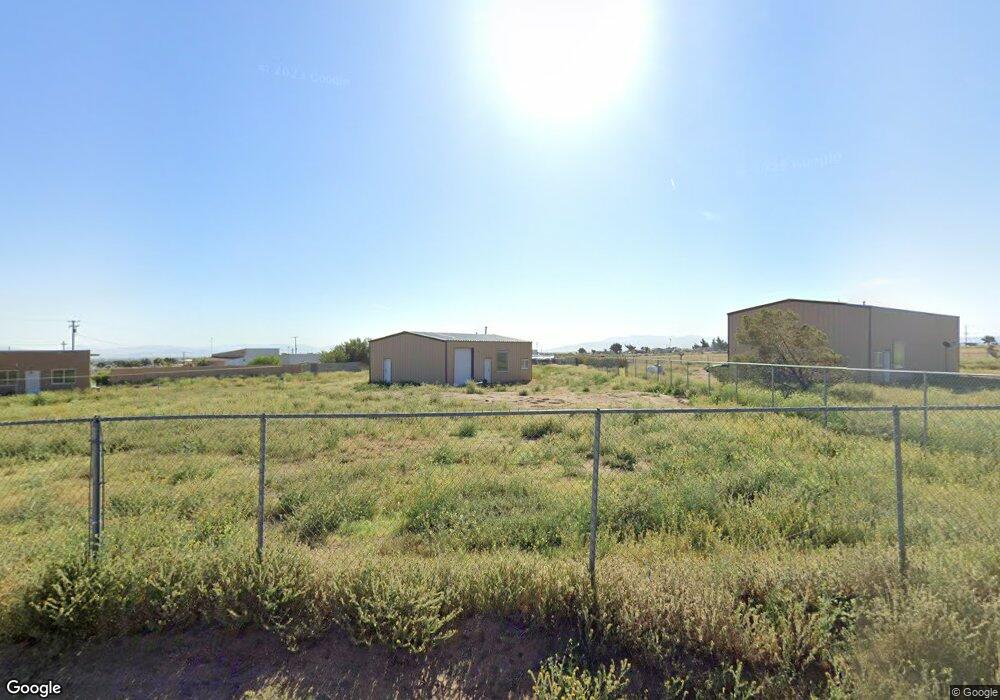
9853 White Rd Unit A Phelan, CA 92371
Estimated Value: $388,115 - $690,000
2
Beds
2
Baths
2,500
Sq Ft
$194/Sq Ft
Est. Value
About This Home
This home is located at 9853 White Rd Unit A, Phelan, CA 92371 and is currently estimated at $484,529, approximately $193 per square foot. 9853 White Rd Unit A is a home located in San Bernardino County with nearby schools including Baldy Mesa Elementary School, Quail Valley Middle School, and Serrano High School.
Ownership History
Date
Name
Owned For
Owner Type
Purchase Details
Closed on
Aug 22, 2019
Sold by
Moon David T
Bought by
Moon Lynn Norman
Current Estimated Value
Purchase Details
Closed on
Oct 26, 2005
Sold by
Moon David Thomas
Bought by
Moon David Thomas
Home Financials for this Owner
Home Financials are based on the most recent Mortgage that was taken out on this home.
Original Mortgage
$252,000
Outstanding Balance
$135,022
Interest Rate
5.68%
Mortgage Type
Stand Alone Refi Refinance Of Original Loan
Estimated Equity
$349,507
Purchase Details
Closed on
Jun 18, 2004
Sold by
Moon David Thomas
Bought by
Moon David Thomas
Home Financials for this Owner
Home Financials are based on the most recent Mortgage that was taken out on this home.
Original Mortgage
$135,000
Interest Rate
6.31%
Mortgage Type
Stand Alone Refi Refinance Of Original Loan
Purchase Details
Closed on
Feb 19, 2003
Sold by
Mckinnis Charles Keith
Bought by
Moon David Thomas
Create a Home Valuation Report for This Property
The Home Valuation Report is an in-depth analysis detailing your home's value as well as a comparison with similar homes in the area
Home Values in the Area
Average Home Value in this Area
Purchase History
| Date | Buyer | Sale Price | Title Company |
|---|---|---|---|
| Moon Lynn Norman | -- | None Available | |
| Moon David Thomas | -- | United Title Orange County | |
| Moon David Thomas | -- | North American Title Company | |
| Moon David Thomas | -- | -- |
Source: Public Records
Mortgage History
| Date | Status | Borrower | Loan Amount |
|---|---|---|---|
| Open | Moon David Thomas | $252,000 | |
| Closed | Moon David Thomas | $135,000 |
Source: Public Records
Tax History
| Year | Tax Paid | Tax Assessment Tax Assessment Total Assessment is a certain percentage of the fair market value that is determined by local assessors to be the total taxable value of land and additions on the property. | Land | Improvement |
|---|---|---|---|---|
| 2025 | $3,619 | $299,242 | $43,450 | $255,792 |
| 2024 | $3,387 | $293,374 | $42,598 | $250,776 |
| 2023 | $3,346 | $287,622 | $41,763 | $245,859 |
| 2022 | $3,267 | $281,982 | $40,944 | $241,038 |
| 2021 | $3,205 | $276,453 | $40,141 | $236,312 |
| 2020 | $3,164 | $273,618 | $39,729 | $233,889 |
| 2019 | $3,101 | $268,253 | $38,950 | $229,303 |
| 2018 | $2,887 | $262,993 | $38,186 | $224,807 |
| 2017 | $2,835 | $257,836 | $37,437 | $220,399 |
| 2016 | $2,795 | $252,780 | $36,703 | $216,077 |
| 2015 | $2,759 | $248,983 | $36,152 | $212,831 |
| 2014 | $2,718 | $244,106 | $35,444 | $208,662 |
Source: Public Records
Map
Nearby Homes
- 9548 White Rd
- 8485 White Fox Trail
- 0 Beaver Unit CV25127667
- 9951 Arrowhead Rd
- 4044 Nielson Rd
- 9760 Phelan Rd
- 9176 Arrowhead Rd
- 10626 Beaver Ave
- 0 Alta Mesa Rd
- 9735 Elsinore Rd
- 0 Valencia St Unit CV25236923
- 0 Muscatel St
- 0 White Rd Unit CV25118907
- 9283 Atsina Rd
- 0 Shasta Rd Unit HD25245286
- 0 Shasta Rd Unit HD25246899
- 0 Mesa St Unit 25006916
- 0 Mesa St Unit SR25147417
- 9448 Braceo St
- 8135 Joshua St
- 8989 White Fox Trail
- 9922 White Rd
- 9923 White Rd
- 9989 White Rd
- 8989 Acacia Rd
- 9970 White Rd
- 9770 Sunny Vista Rd
- 9888 Sunny Vista Rd
- 8909 Phelan Rd
- 8967 Acacia Rd
- 10025 White Rd
- 10020 White Rd
- 9875 Sunny Vista Rd
- 9015 Acacia Rd
- 9927 Sunny Vista Rd
- 9059 Yucca Terrace Dr
- 10076 White Rd Unit 155
- 10076 White Rd
- 9095 Yucca Terrace Dr
- 9951 Sunny Vista Rd