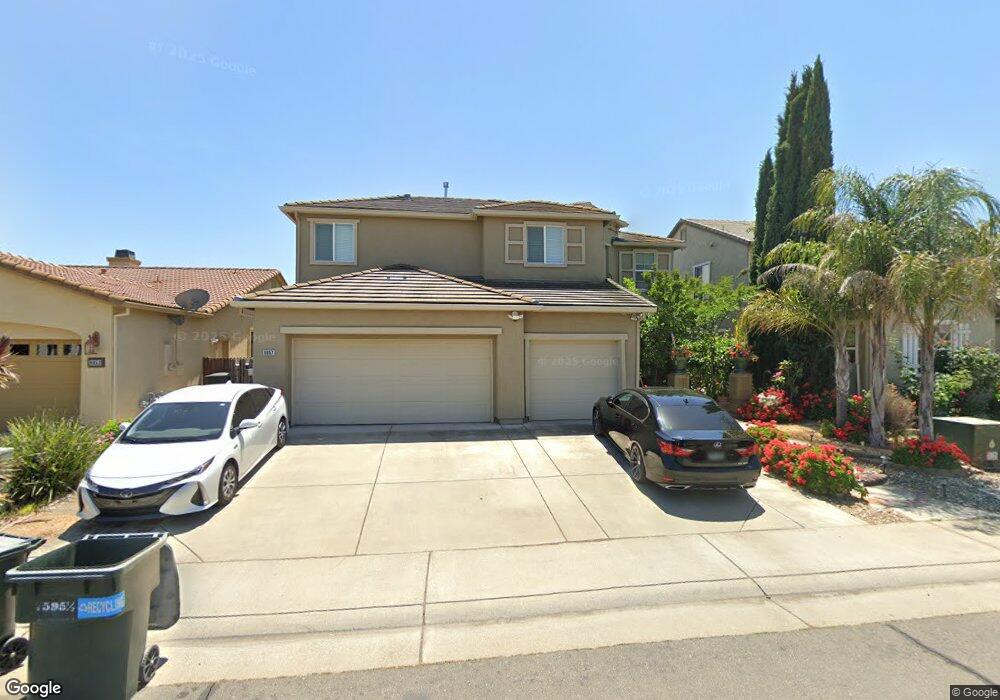
9857 Fall Valley Way Sacramento, CA 95829
Estimated Value: $467,000 - $781,000
5
Beds
3
Baths
3,046
Sq Ft
$220/Sq Ft
Est. Value
About This Home
This home is located at 9857 Fall Valley Way, Sacramento, CA 95829 and is currently estimated at $671,498, approximately $220 per square foot. 9857 Fall Valley Way is a home located in Sacramento County with nearby schools including Robert J. Fite Elementary School, T. R. Smedberg Middle School, and Sheldon High School.
Ownership History
Date
Name
Owned For
Owner Type
Purchase Details
Closed on
Oct 13, 2015
Sold by
Concepcion Anthony
Bought by
Vu Tram
Current Estimated Value
Home Financials for this Owner
Home Financials are based on the most recent Mortgage that was taken out on this home.
Original Mortgage
$242,000
Outstanding Balance
$190,209
Interest Rate
3.85%
Mortgage Type
New Conventional
Estimated Equity
$481,289
Purchase Details
Closed on
Jan 20, 2005
Sold by
Nguyen Vincent
Bought by
Vu Diep
Purchase Details
Closed on
Oct 22, 2004
Sold by
Richmond American Homes Of Ca Inc
Bought by
Nguyen Vincent
Home Financials for this Owner
Home Financials are based on the most recent Mortgage that was taken out on this home.
Original Mortgage
$291,400
Interest Rate
5.79%
Mortgage Type
Purchase Money Mortgage
Create a Home Valuation Report for This Property
The Home Valuation Report is an in-depth analysis detailing your home's value as well as a comparison with similar homes in the area
Home Values in the Area
Average Home Value in this Area
Purchase History
| Date | Buyer | Sale Price | Title Company |
|---|---|---|---|
| Vu Tram | -- | Orange Coast Title Co Norcal | |
| Vu Diep | -- | Orange Coast Title Co Norcal | |
| Vu Diep | -- | -- | |
| Nguyen Vincent | $416,500 | Stewart Title Of Sacramento |
Source: Public Records
Mortgage History
| Date | Status | Borrower | Loan Amount |
|---|---|---|---|
| Open | Vu Diep | $242,000 | |
| Previous Owner | Nguyen Vincent | $291,400 |
Source: Public Records
Tax History Compared to Growth
Tax History
| Year | Tax Paid | Tax Assessment Tax Assessment Total Assessment is a certain percentage of the fair market value that is determined by local assessors to be the total taxable value of land and additions on the property. | Land | Improvement |
|---|---|---|---|---|
| 2025 | $5,908 | $532,805 | $122,434 | $410,371 |
| 2024 | $5,908 | $522,359 | $120,034 | $402,325 |
| 2023 | $5,764 | $512,118 | $117,681 | $394,437 |
| 2022 | $5,667 | $502,077 | $115,374 | $386,703 |
| 2021 | $5,606 | $492,233 | $113,112 | $379,121 |
| 2020 | $5,533 | $487,187 | $111,953 | $375,234 |
| 2019 | $5,435 | $477,635 | $109,758 | $367,877 |
| 2018 | $5,293 | $468,270 | $107,606 | $360,664 |
| 2017 | $5,203 | $459,090 | $105,497 | $353,593 |
| 2016 | $4,622 | $417,932 | $107,411 | $310,521 |
| 2015 | $4,291 | $387,149 | $108,929 | $278,220 |
| 2014 | $4,078 | $365,235 | $102,763 | $262,472 |
Source: Public Records
Map
Nearby Homes
- 9865 Fall Valley Way
- 9781 Fall Valley Way
- 9633 Respect Dr
- 8210 Scrimshaw Way
- 8295 Carmencita Ave
- 9864 Wildhawk Dr W
- 8298 Courage Dr
- 7775 Saptal Way
- 7781 Sikh Ct
- 7776 Sikh Ct
- 7772 Sikh Ct
- 9826 Amisha Way
- 8312 Cabochon Way
- 8294 Courage Dr
- 9835 Amisha Way
- 7724 Congaree Way
- 7728 Congaree Way
- 8174 Finmere Way
- 7736 Congaree Way
- 7855 Yellow Cups Way
- 9853 Fall Valley Way
- 9849 Fall Valley Way
- 9723 Vintage Park Dr
- 9719 Vintage Park Dr
- 9727 Vintage Park Dr
- 9856 Fall Valley Way
- 9860 Fall Valley Way
- 9852 Fall Valley Way
- 9845 Fall Valley Way
- 9869 Fall Valley Way
- 9715 Vintage Park Dr
- 9864 Fall Valley Way
- 9848 Fall Valley Way
- 9731 Vintage Park Dr
- 9868 Fall Valley Way
- 9844 Fall Valley Way
- 9873 Fall Valley Way
- 9841 Fall Valley Way
- 9711 Vintage Park Dr
- 9735 Vintage Park Dr