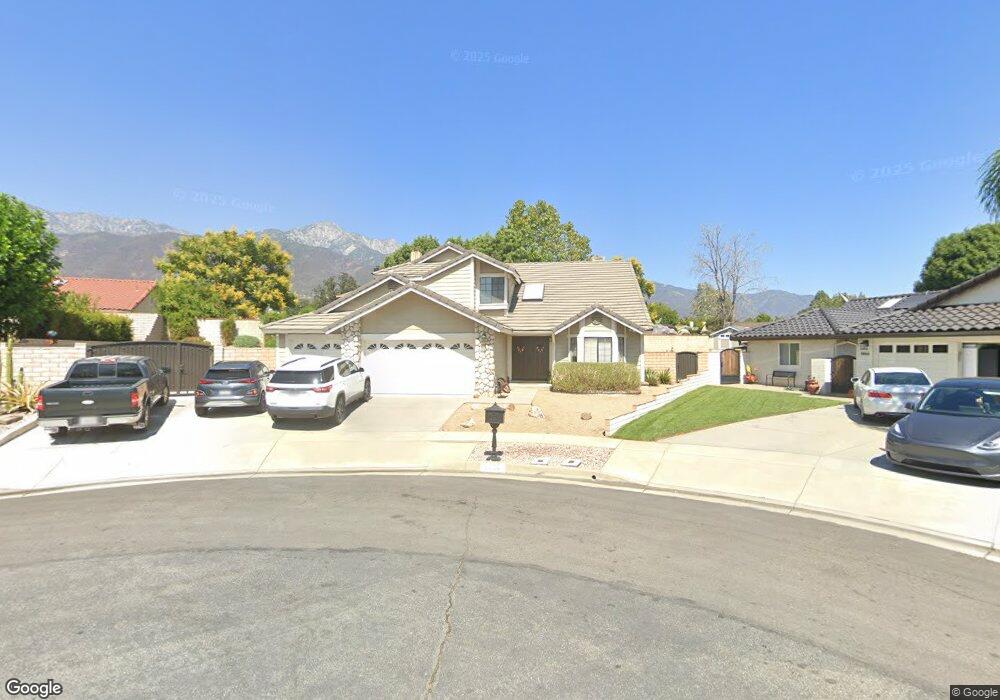
9858 Cypress Ct Rancho Cucamonga, CA 91737
Estimated Value: $843,525 - $986,000
4
Beds
3
Baths
2,009
Sq Ft
$450/Sq Ft
Est. Value
About This Home
This home is located at 9858 Cypress Ct, Rancho Cucamonga, CA 91737 and is currently estimated at $903,131, approximately $449 per square foot. 9858 Cypress Ct is a home located in San Bernardino County with nearby schools including Hermosa Elementary, Vineyard Junior High, and Los Osos High.
Ownership History
Date
Name
Owned For
Owner Type
Purchase Details
Closed on
Jan 11, 2013
Sold by
Miniskey David L
Bought by
Miniskey David L
Current Estimated Value
Home Financials for this Owner
Home Financials are based on the most recent Mortgage that was taken out on this home.
Original Mortgage
$301,000
Outstanding Balance
$209,188
Interest Rate
3.36%
Mortgage Type
New Conventional
Estimated Equity
$693,943
Purchase Details
Closed on
Jan 27, 2011
Sold by
Miniskey Jennifer M
Bought by
Miniskey David L
Home Financials for this Owner
Home Financials are based on the most recent Mortgage that was taken out on this home.
Original Mortgage
$300,000
Interest Rate
4.82%
Mortgage Type
New Conventional
Purchase Details
Closed on
Mar 2, 1998
Sold by
Jackson Bruce and Jackson Charlene S
Bought by
Miniskey David L and Miniskey Jennifer M
Home Financials for this Owner
Home Financials are based on the most recent Mortgage that was taken out on this home.
Original Mortgage
$194,275
Interest Rate
7.18%
Create a Home Valuation Report for This Property
The Home Valuation Report is an in-depth analysis detailing your home's value as well as a comparison with similar homes in the area
Home Values in the Area
Average Home Value in this Area
Purchase History
| Date | Buyer | Sale Price | Title Company |
|---|---|---|---|
| Miniskey David L | -- | Orange Coast Title Company O | |
| Miniskey David L | -- | Orange Coast Title Of The In | |
| Miniskey David L | $204,500 | First American Title Ins Co |
Source: Public Records
Mortgage History
| Date | Status | Borrower | Loan Amount |
|---|---|---|---|
| Open | Miniskey David L | $301,000 | |
| Closed | Miniskey David L | $300,000 | |
| Previous Owner | Miniskey David L | $194,275 |
Source: Public Records
Tax History Compared to Growth
Tax History
| Year | Tax Paid | Tax Assessment Tax Assessment Total Assessment is a certain percentage of the fair market value that is determined by local assessors to be the total taxable value of land and additions on the property. | Land | Improvement |
|---|---|---|---|---|
| 2025 | $3,643 | $320,604 | $80,112 | $240,492 |
| 2024 | $3,643 | $314,317 | $78,541 | $235,776 |
| 2023 | $3,565 | $308,154 | $77,001 | $231,153 |
| 2022 | $3,556 | $302,112 | $75,491 | $226,621 |
| 2021 | $3,555 | $296,188 | $74,011 | $222,177 |
| 2020 | $3,415 | $293,151 | $73,252 | $219,899 |
| 2019 | $3,453 | $287,403 | $71,816 | $215,587 |
| 2018 | $3,379 | $281,768 | $70,408 | $211,360 |
| 2017 | $3,232 | $276,243 | $69,027 | $207,216 |
| 2016 | $3,149 | $270,827 | $67,674 | $203,153 |
| 2015 | $3,130 | $266,758 | $66,657 | $200,101 |
| 2014 | $3,046 | $261,532 | $65,351 | $196,181 |
Source: Public Records
Map
Nearby Homes
- 9855 Banyan St
- 6360 Daylily Ct
- 10655 401 Lemon Ave Unit 401
- 9757 Balaton St
- 6155 Klusman Ave
- 10141 Orange St
- 6281 Kinlock Ave
- 9504 Lemon Ave
- 10123 Finch Ave
- 6600 Montresor Place
- 5885 Zapata Place
- 9979 Timbermist Ct
- 6055 Amethyst Ave
- 10330 Orange St
- 9438 La Gloria Dr
- 6740 London Ave
- 6644 Brissac Place
- 9513 Sunflower St
- 10393 Cartilla Ct
- 9740 Woodleaf Dr
- 9857 Hibiscus Ct
- 9868 Cypress Ct
- 9846 Cypress Ct
- 9869 Hibiscus Ct
- 9847 Hibiscus Ct
- 9867 Cypress Ct
- 9859 Cypress Ct
- 9836 Cypress Ct
- 9849 Cypress Ct
- 9835 Hibiscus Ct
- 9866 Hibiscus Ct
- 6248 Ramona St
- 9856 Hibiscus Ct
- 9839 Cypress Ct
- 9910 Lemon Ave
- 9846 Hibiscus Ct
- 9828 Cypress Ct
- 9829 Hibiscus Ct
- 6238 Ramona St
- 9836 Hibiscus Ct