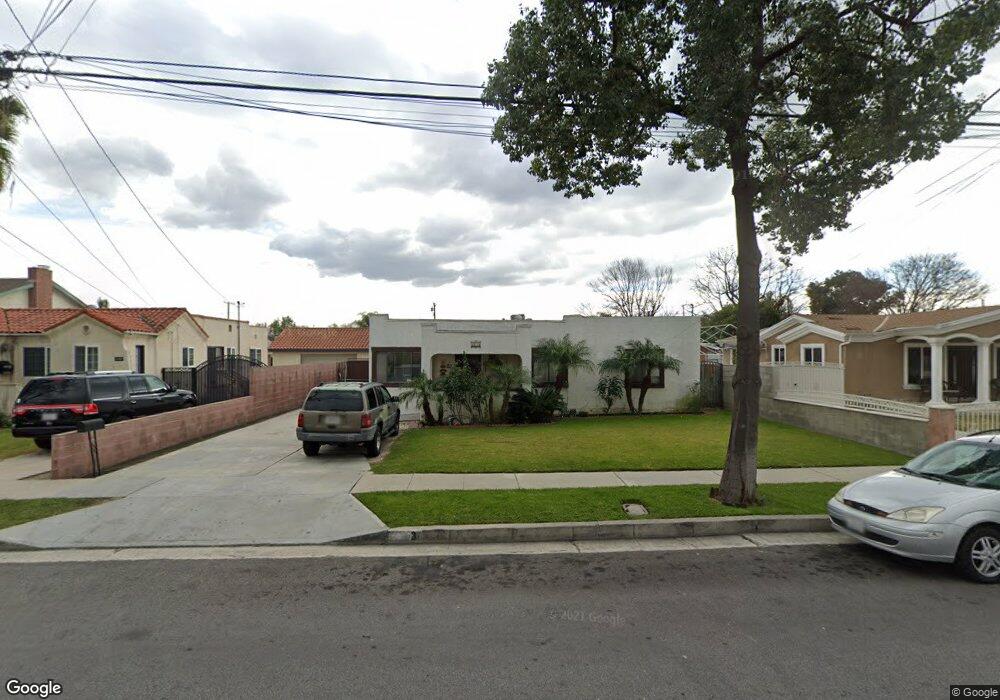
9858 Park St Bellflower, CA 90706
Estimated Value: $844,651 - $1,027,000
4
Beds
2
Baths
1,476
Sq Ft
$634/Sq Ft
Est. Value
About This Home
This home is located at 9858 Park St, Bellflower, CA 90706 and is currently estimated at $935,913, approximately $634 per square foot. 9858 Park St is a home located in Los Angeles County with nearby schools including Thomas Jefferson Elementary School, Mayfair High School, and St. Bernard School.
Ownership History
Date
Name
Owned For
Owner Type
Purchase Details
Closed on
Oct 19, 2007
Sold by
Fernandez Carolina Osorio
Bought by
Fernandez Ramiro
Current Estimated Value
Home Financials for this Owner
Home Financials are based on the most recent Mortgage that was taken out on this home.
Original Mortgage
$200,000
Outstanding Balance
$125,245
Interest Rate
6.27%
Mortgage Type
New Conventional
Estimated Equity
$810,668
Purchase Details
Closed on
Jun 9, 2006
Sold by
Fernandez Argemiro J and Fernandez Noelia
Bought by
Fernandez Ramiro
Purchase Details
Closed on
Feb 4, 2005
Sold by
Fernandez Noelia
Bought by
Fernandez Noelia
Purchase Details
Closed on
Jan 31, 2003
Sold by
Fernandez Julio
Bought by
Fernandez Noelia
Home Financials for this Owner
Home Financials are based on the most recent Mortgage that was taken out on this home.
Original Mortgage
$155,000
Interest Rate
5.37%
Create a Home Valuation Report for This Property
The Home Valuation Report is an in-depth analysis detailing your home's value as well as a comparison with similar homes in the area
Home Values in the Area
Average Home Value in this Area
Purchase History
| Date | Buyer | Sale Price | Title Company |
|---|---|---|---|
| Fernandez Ramiro | -- | Commerce Title | |
| Fernandez Ramiro | -- | None Available | |
| Fernandez Noelia | -- | -- | |
| Fernandez Noelia | -- | Landamerica Lawyers Title |
Source: Public Records
Mortgage History
| Date | Status | Borrower | Loan Amount |
|---|---|---|---|
| Open | Fernandez Ramiro | $200,000 | |
| Previous Owner | Fernandez Noelia | $155,000 | |
| Closed | Fernandez Noelia | $20,000 |
Source: Public Records
Tax History Compared to Growth
Tax History
| Year | Tax Paid | Tax Assessment Tax Assessment Total Assessment is a certain percentage of the fair market value that is determined by local assessors to be the total taxable value of land and additions on the property. | Land | Improvement |
|---|---|---|---|---|
| 2025 | $4,137 | $293,285 | $67,927 | $225,358 |
| 2024 | $4,137 | $287,536 | $66,596 | $220,940 |
| 2023 | $3,723 | $281,899 | $65,291 | $216,608 |
| 2022 | $3,657 | $276,372 | $64,011 | $212,361 |
| 2021 | $3,581 | $270,954 | $62,756 | $208,198 |
| 2019 | $3,491 | $262,920 | $60,896 | $202,024 |
| 2018 | $3,284 | $257,765 | $59,702 | $198,063 |
| 2016 | $3,144 | $247,758 | $57,385 | $190,373 |
| 2015 | $3,080 | $244,038 | $56,524 | $187,514 |
| 2014 | $3,044 | $239,258 | $55,417 | $183,841 |
Source: Public Records
Map
Nearby Homes
- 9833 Palm St
- 9929 Park St
- 9833 Walnut St
- 10117 Palm St
- 16712 Bellflower Blvd
- 16821 Ardmore Ave
- 9713 Cedar St
- 9719 Belmont St
- 9716 Oak St
- 10013 Flora Vista St
- 9928 Cedar St
- 9924 Cedar St
- 16414 Cornuta Ave Unit 8
- 16414 Cornuta Ave Unit 11
- 9921 Flora Vista St Unit 5
- 10240 Artesia Blvd
- 17046 Clark Ave
- 9513 Cedar St
- 17625 Carpintero Ave Unit 62
- 5549 Ashworth St