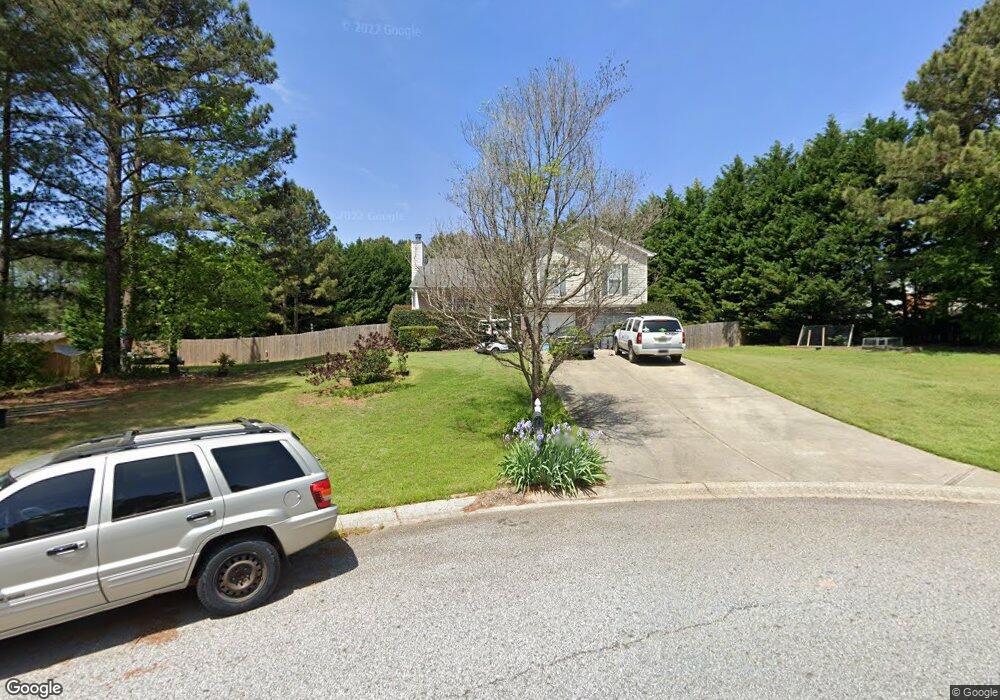
986 Camellia Ct Unit 12C Bethlehem, GA 30620
Estimated Value: $326,379 - $337,000
3
Beds
2
Baths
1,602
Sq Ft
$208/Sq Ft
Est. Value
About This Home
This home is located at 986 Camellia Ct Unit 12C, Bethlehem, GA 30620 and is currently estimated at $332,845, approximately $207 per square foot. 986 Camellia Ct Unit 12C is a home located in Barrow County with nearby schools including Yargo Elementary School, Haymon-Morris Middle School, and Apalachee High School.
Ownership History
Date
Name
Owned For
Owner Type
Purchase Details
Closed on
May 31, 2007
Sold by
Norton Kevin M and Norton Tracey A
Bought by
Mcmullen Rachel
Current Estimated Value
Home Financials for this Owner
Home Financials are based on the most recent Mortgage that was taken out on this home.
Original Mortgage
$135,500
Outstanding Balance
$82,597
Interest Rate
6.12%
Mortgage Type
New Conventional
Estimated Equity
$250,248
Purchase Details
Closed on
Aug 29, 2003
Sold by
Southfork Hms Inc
Bought by
Norton Kevin M and Norton Tracey
Home Financials for this Owner
Home Financials are based on the most recent Mortgage that was taken out on this home.
Original Mortgage
$122,400
Interest Rate
6.33%
Mortgage Type
New Conventional
Purchase Details
Closed on
Aug 19, 2003
Sold by
Parkview Development Inc
Bought by
Southfork Homes Inc
Home Financials for this Owner
Home Financials are based on the most recent Mortgage that was taken out on this home.
Original Mortgage
$122,400
Interest Rate
6.33%
Mortgage Type
New Conventional
Purchase Details
Closed on
May 2, 2000
Bought by
Parkview Development Inc
Create a Home Valuation Report for This Property
The Home Valuation Report is an in-depth analysis detailing your home's value as well as a comparison with similar homes in the area
Home Values in the Area
Average Home Value in this Area
Purchase History
| Date | Buyer | Sale Price | Title Company |
|---|---|---|---|
| Mcmullen Rachel | $135,500 | -- | |
| Norton Kevin M | $122,400 | -- | |
| Southfork Homes Inc | $280,000 | -- | |
| Parkview Development Inc | -- | -- |
Source: Public Records
Mortgage History
| Date | Status | Borrower | Loan Amount |
|---|---|---|---|
| Open | Mcmullen Rachel | $135,500 | |
| Previous Owner | Norton Kevin M | $122,400 |
Source: Public Records
Tax History Compared to Growth
Tax History
| Year | Tax Paid | Tax Assessment Tax Assessment Total Assessment is a certain percentage of the fair market value that is determined by local assessors to be the total taxable value of land and additions on the property. | Land | Improvement |
|---|---|---|---|---|
| 2024 | $2,683 | $109,030 | $25,200 | $83,830 |
| 2023 | $2,280 | $109,630 | $25,200 | $84,430 |
| 2022 | $2,249 | $79,314 | $20,000 | $59,314 |
| 2021 | $2,076 | $69,442 | $16,000 | $53,442 |
| 2020 | $1,843 | $61,614 | $16,000 | $45,614 |
| 2019 | $1,874 | $61,614 | $16,000 | $45,614 |
| 2018 | $1,764 | $58,814 | $13,200 | $45,614 |
| 2017 | $1,464 | $50,274 | $13,200 | $37,074 |
| 2016 | $1,286 | $44,204 | $13,200 | $31,004 |
| 2015 | $1,302 | $44,546 | $13,200 | $31,346 |
| 2014 | $1,115 | $38,156 | $6,468 | $31,688 |
| 2013 | -- | $36,163 | $6,468 | $29,695 |
Source: Public Records
Map
Nearby Homes
- 0 Jb Owens Unit 7552902
- 0 Jb Owens Unit 7552891
- 0 Jb Owens Unit LOT 2 - 2.09 ACRES
- 0 Jb Owens Unit LOT 3 - 2.01 ACRES
- 303 Ron Dr
- 190 Lokeys Ln
- 637 Sleeping Meadow Ln
- The Barnes Plan at River Meadows
- The Paisley Plan at River Meadows
- The Rose II Plan at River Meadows
- The Logan Plan at River Meadows
- 0 Tanners Bridge Rd Unit 10588144
- 209 Angie Way
- 763 Moss Side Dr
- 1129 Loganville Hwy
- 286 Meadows Dr
- 758 Clarence Edwards Rd
- 1111 Otis Dr
- 1071 Covenant Ct
- 103 Camp Ct
- 986 Camellia Ct
- 111 Trail Winds Dr
- 56 Hargrave Ave
- 40 Hargrave Ave
- 1222 Persimmon Place Dr
- 1222 Persimmon Place Dr Unit 3
- 1220 Persimmon Place Dr Unit 15C
- 987 Camellia Ct
- 535 Pin Oak Dr Unit 3
- 982 Camellia Ct
- 982 Camellia Ct Unit 3
- 531 Pin Oak Dr Unit 21C
- 531 Pin Oak Dr
- 533 Pin Oak Dr Unit 22C
- 533 Pin Oak Dr
- 985 Camellia Ct Unit 10C
- 985 Camellia Ct
- 1218 Persimmon Place Dr Unit 16C
- 1218 Persimmon Place Dr Unit 3
- 1204 Persimmon Place Dr Unit 19C