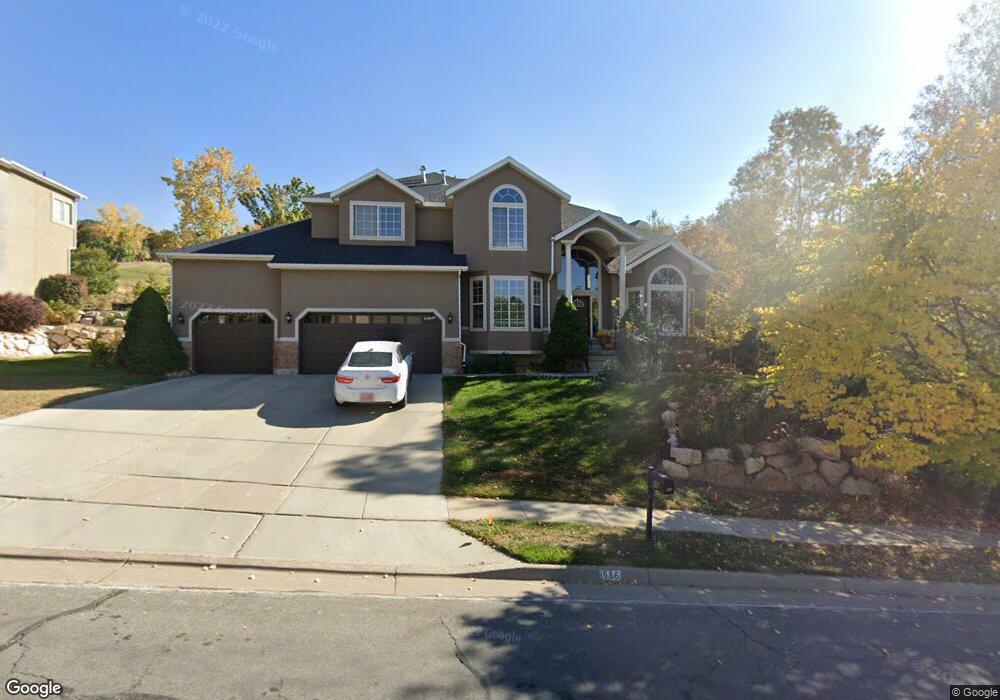
986 E Fairway Dr North Salt Lake, UT 84054
Estimated Value: $928,000 - $1,131,000
5
Beds
3
Baths
4,848
Sq Ft
$209/Sq Ft
Est. Value
About This Home
This home is located at 986 E Fairway Dr, North Salt Lake, UT 84054 and is currently estimated at $1,014,886, approximately $209 per square foot. 986 E Fairway Dr is a home located in Davis County with nearby schools including Adelaide School, South Davis Junior High School, and Woods Cross High School.
Ownership History
Date
Name
Owned For
Owner Type
Purchase Details
Closed on
Mar 25, 2019
Sold by
Phan Peter and Phan Jane K
Bought by
Phan Jane K
Current Estimated Value
Home Financials for this Owner
Home Financials are based on the most recent Mortgage that was taken out on this home.
Original Mortgage
$384,000
Outstanding Balance
$336,914
Interest Rate
4.3%
Mortgage Type
New Conventional
Estimated Equity
$677,972
Purchase Details
Closed on
Nov 16, 2016
Sold by
Phan Jane K and Phan Peter
Bought by
Phan Peter and Phan Jane K
Purchase Details
Closed on
Oct 12, 2001
Sold by
Phan Peter and Phan Jane K
Bought by
Phan Peter and Phan Jane K
Home Financials for this Owner
Home Financials are based on the most recent Mortgage that was taken out on this home.
Original Mortgage
$284,000
Interest Rate
6.88%
Purchase Details
Closed on
May 8, 2000
Sold by
Perry Homes Inc
Bought by
Phan Peter and Phan Jane K
Home Financials for this Owner
Home Financials are based on the most recent Mortgage that was taken out on this home.
Original Mortgage
$280,000
Interest Rate
8.25%
Create a Home Valuation Report for This Property
The Home Valuation Report is an in-depth analysis detailing your home's value as well as a comparison with similar homes in the area
Home Values in the Area
Average Home Value in this Area
Purchase History
| Date | Buyer | Sale Price | Title Company |
|---|---|---|---|
| Phan Jane K | -- | None Available | |
| Phan Peter | -- | Meridian Title | |
| Phan Peter | -- | Associated Title Company | |
| Phan Peter | -- | Surety Title Agency | |
| Perry Homes Inc | -- | Surety Title Agency |
Source: Public Records
Mortgage History
| Date | Status | Borrower | Loan Amount |
|---|---|---|---|
| Open | Phan Jane K | $384,000 | |
| Closed | Phan Peter | $284,000 | |
| Closed | Phan Peter | $280,000 |
Source: Public Records
Tax History Compared to Growth
Tax History
| Year | Tax Paid | Tax Assessment Tax Assessment Total Assessment is a certain percentage of the fair market value that is determined by local assessors to be the total taxable value of land and additions on the property. | Land | Improvement |
|---|---|---|---|---|
| 2025 | $4,276 | $454,300 | $175,767 | $278,533 |
| 2024 | $4,276 | $430,100 | $171,336 | $258,764 |
| 2023 | $4,482 | $815,000 | $246,729 | $568,271 |
| 2022 | $4,474 | $446,600 | $153,596 | $293,004 |
| 2021 | $3,921 | $594,000 | $234,995 | $359,005 |
| 2020 | $3,477 | $521,000 | $193,262 | $327,738 |
| 2019 | $3,524 | $515,000 | $188,104 | $326,896 |
| 2018 | $3,321 | $480,000 | $168,321 | $311,679 |
| 2016 | $3,228 | $248,106 | $54,027 | $194,079 |
| 2015 | $2,963 | $218,846 | $54,027 | $164,819 |
| 2014 | $2,654 | $199,813 | $54,027 | $145,786 |
| 2013 | -- | $210,650 | $80,143 | $130,507 |
Source: Public Records
Map
Nearby Homes
- 1036 E Fairway Dr
- 53 N Foxhill Rd
- 368 W Davis Blvd
- 3975 S Monarch Dr E
- 310 N 675 E
- 178 N Valley View Dr
- 3498 S 525 W
- 426 N Orchard Dr Unit 5
- 22 W 3500 S
- 8 E 3500 S
- 3716 S Oakridge Cir
- 93 N Valley View Dr
- 151 S Bernice Way
- 620 N Orchard Dr Unit 15
- 620 N Orchard Dr Unit 11
- 3183 S 500 W
- 3463 S 50 E
- 527 Applewood Dr
- 3474 S 100 E
- 585 Marialana Way
- 998 E Fairway Dr
- 198 N Eaglewood Dr
- 239 Springridge Dr
- 1010 E Fairway Dr
- 251 Springridge Dr
- 1003 E Fairway Dr
- 949 E Eaglewood Dr Unit 11-A
- 1024 E Fairway Dr
- 942 Sable Cir
- 988 Springridge Cir
- 944 Sable Cir
- 259 Springridge Dr
- 1015 E Fairway Dr
- 1002 Springridge Cir
- 935 E Eaglewood Dr
- 1027 E Fairway Dr
- 267 Springridge Dr
- 981 Springridge Cir
- 178 N Eaglewood Dr
- 926 E Eaglewood Dr