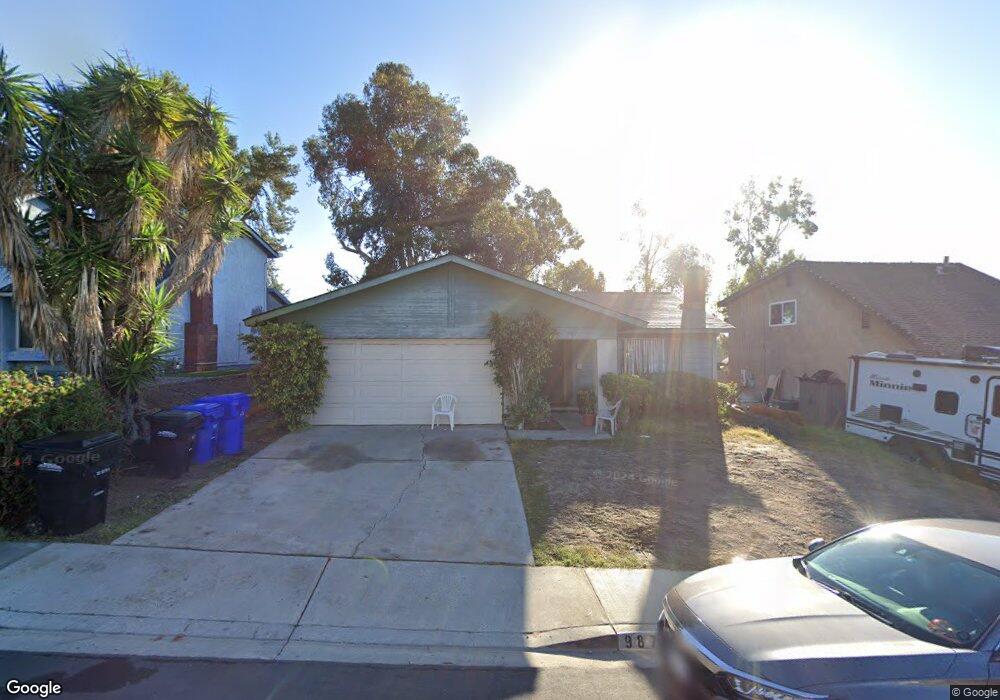
987 Dimarino St San Diego, CA 92114
Jamacha Lomita NeighborhoodEstimated Value: $737,062 - $795,000
3
Beds
2
Baths
1,260
Sq Ft
$611/Sq Ft
Est. Value
About This Home
This home is located at 987 Dimarino St, San Diego, CA 92114 and is currently estimated at $769,516, approximately $610 per square foot. 987 Dimarino St is a home located in San Diego County with nearby schools including Monterey Heights Elementary, Mount Miguel High School, and Keiller Leadership Academy.
Ownership History
Date
Name
Owned For
Owner Type
Purchase Details
Closed on
Mar 18, 2014
Sold by
Sloan Joseph Edward
Bought by
Wang Jing
Current Estimated Value
Purchase Details
Closed on
Jan 6, 2005
Sold by
Pham My Linh
Bought by
Sloan Joseph Edward
Purchase Details
Closed on
May 13, 1997
Sold by
Secretary Of Veterans Affairs
Bought by
Pham My Linh and Pham My Trang
Home Financials for this Owner
Home Financials are based on the most recent Mortgage that was taken out on this home.
Original Mortgage
$111,400
Interest Rate
7.98%
Mortgage Type
Seller Take Back
Purchase Details
Closed on
Aug 6, 1996
Sold by
Norwest Mtg Inc
Bought by
Va
Purchase Details
Closed on
Nov 4, 1991
Purchase Details
Closed on
May 20, 1987
Purchase Details
Closed on
Jun 1, 1983
Create a Home Valuation Report for This Property
The Home Valuation Report is an in-depth analysis detailing your home's value as well as a comparison with similar homes in the area
Home Values in the Area
Average Home Value in this Area
Purchase History
| Date | Buyer | Sale Price | Title Company |
|---|---|---|---|
| Wang Jing | -- | None Available | |
| Sloan Joseph Edward | -- | -- | |
| Pham My Linh | $113,000 | Stewart Title | |
| Va | -- | Stewart Title | |
| Norwest Mtg Inc | $112,055 | Stewart Title | |
| -- | $141,000 | -- | |
| -- | $93,100 | -- | |
| -- | $84,800 | -- |
Source: Public Records
Mortgage History
| Date | Status | Borrower | Loan Amount |
|---|---|---|---|
| Previous Owner | Pham My Linh | $111,400 |
Source: Public Records
Tax History Compared to Growth
Tax History
| Year | Tax Paid | Tax Assessment Tax Assessment Total Assessment is a certain percentage of the fair market value that is determined by local assessors to be the total taxable value of land and additions on the property. | Land | Improvement |
|---|---|---|---|---|
| 2025 | $4,689 | $394,490 | $254,451 | $140,039 |
| 2024 | $4,689 | $386,756 | $249,462 | $137,294 |
| 2023 | $4,556 | $379,173 | $244,571 | $134,602 |
| 2022 | $4,529 | $371,739 | $239,776 | $131,963 |
| 2021 | $4,461 | $364,451 | $235,075 | $129,376 |
| 2020 | $4,420 | $360,715 | $232,665 | $128,050 |
| 2019 | $4,359 | $353,643 | $228,103 | $125,540 |
| 2018 | $4,265 | $346,710 | $223,631 | $123,079 |
| 2017 | $80 | $339,913 | $219,247 | $120,666 |
| 2016 | $4,075 | $333,249 | $214,949 | $118,300 |
| 2015 | $4,047 | $328,245 | $211,721 | $116,524 |
| 2014 | $3,879 | $321,816 | $207,574 | $114,242 |
Source: Public Records
Map
Nearby Homes
- 1062 Armacost Rd
- 1164 Woodrow Ave Unit 2
- 1434 San Altos Place
- 1817 Ramon St
- 7420 Jamacha Rd
- 7023 Lisbon St
- 6859 Broadway Unit 1
- 1845 Madera St
- 351 Winewood St
- 1277 Glencoe Dr
- 1795 Lemon Grove Ave
- 7085 Madrone Ave
- 0 Dartmoor Dr Unit 1
- 1928 Noble St
- 7215 San Pasqual St
- 1172 Bittern St
- 1350 Hilger St
- 7936 Pala St
- 373 69th St
- 7087 Russan Ln
- 993 Dimarino St
- 981 Dimarino St
- 1003 Dimarino St
- 975 Dimarino St
- 1044 Woodrow Ave
- 1058 Woodrow Ave
- 969 di Marino St
- 969 Dimarino St
- 1009 Dimarino St
- 1030 Woodrow Ave
- 1072 Woodrow Ave
- 992 Dimarino St
- 984 Dimarino St
- 976 Dimarino St
- 1016 Woodrow Ave
- 963 Dimarino St
- 7248 Laddeck Ct
- 1086 Woodrow Ave
- 968 Dimarino St
- 1019 Dimarino St