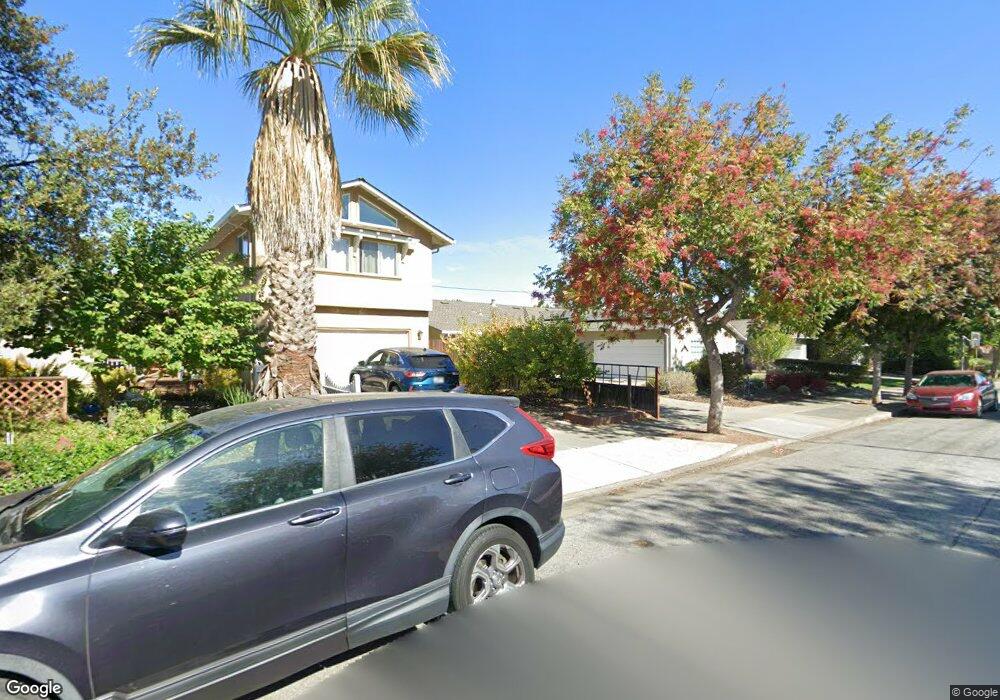
987 Lorne Way Sunnyvale, CA 94087
Birdland Neighbors NeighborhoodEstimated Value: $1,855,000 - $2,655,000
4
Beds
3
Baths
1,210
Sq Ft
$1,985/Sq Ft
Est. Value
About This Home
This home is located at 987 Lorne Way, Sunnyvale, CA 94087 and is currently estimated at $2,401,413, approximately $1,984 per square foot. 987 Lorne Way is a home located in Santa Clara County with nearby schools including Laurelwood Elementary School, Marian A. Peterson Middle School, and Adrian Wilcox High School.
Ownership History
Date
Name
Owned For
Owner Type
Purchase Details
Closed on
Sep 26, 2011
Sold by
Chin Cua Trieu
Bought by
Chin Andy
Current Estimated Value
Home Financials for this Owner
Home Financials are based on the most recent Mortgage that was taken out on this home.
Original Mortgage
$323,000
Outstanding Balance
$220,829
Interest Rate
4.15%
Mortgage Type
New Conventional
Estimated Equity
$2,180,584
Purchase Details
Closed on
Dec 13, 2001
Sold by
Bramlett Clifford J
Bought by
Chin Andy
Home Financials for this Owner
Home Financials are based on the most recent Mortgage that was taken out on this home.
Original Mortgage
$415,200
Interest Rate
6.25%
Purchase Details
Closed on
Mar 12, 2001
Sold by
Bramlett Chester L
Bought by
Bramlett Chester L
Purchase Details
Closed on
Apr 9, 1996
Sold by
Vincent Richard C and Vincent Teresa
Bought by
Bramlett Chester L
Create a Home Valuation Report for This Property
The Home Valuation Report is an in-depth analysis detailing your home's value as well as a comparison with similar homes in the area
Home Values in the Area
Average Home Value in this Area
Purchase History
| Date | Buyer | Sale Price | Title Company |
|---|---|---|---|
| Chin Andy | -- | Chicago Title Company | |
| Chin Andy | $519,000 | Chicago Title Co | |
| Bramlett Chester L | -- | -- | |
| Bramlett Chester L | $308,000 | Stewart Title |
Source: Public Records
Mortgage History
| Date | Status | Borrower | Loan Amount |
|---|---|---|---|
| Open | Chin Andy | $323,000 | |
| Closed | Chin Andy | $415,200 | |
| Closed | Chin Andy | $51,900 |
Source: Public Records
Tax History Compared to Growth
Tax History
| Year | Tax Paid | Tax Assessment Tax Assessment Total Assessment is a certain percentage of the fair market value that is determined by local assessors to be the total taxable value of land and additions on the property. | Land | Improvement |
|---|---|---|---|---|
| 2025 | $10,303 | $894,366 | $552,502 | $341,864 |
| 2024 | $10,303 | $876,830 | $541,669 | $335,161 |
| 2023 | $10,198 | $859,639 | $531,049 | $328,590 |
| 2022 | $9,946 | $842,785 | $520,637 | $322,148 |
| 2021 | $9,906 | $826,261 | $510,429 | $315,832 |
| 2020 | $9,725 | $817,790 | $505,196 | $312,594 |
| 2019 | $9,712 | $801,756 | $495,291 | $306,465 |
| 2018 | $9,086 | $786,036 | $485,580 | $300,456 |
| 2017 | $9,033 | $770,624 | $476,059 | $294,565 |
| 2016 | $8,840 | $755,515 | $466,725 | $288,790 |
| 2015 | $8,806 | $744,168 | $459,715 | $284,453 |
| 2014 | $8,384 | $729,591 | $450,710 | $278,881 |
Source: Public Records
Map
Nearby Homes
- 1015 Gloucester Ct
- 1105 Lorne Way
- 1626 S Wolfe Rd
- 1132 Lochinvar Ave
- 1645 Waxwing Ave
- 1567 Magpie Ln
- 1744 Lark Ln
- 861 Flin Way
- 1472 Hampton Dr
- 10631 Mine Ct
- 1579 Heron Ave
- 1031 Waterbird Way
- 1353 Spoonbill Way
- 3517 Oxford Dr
- 1071 Alta Mira Dr Unit B
- 3457 Forbes Ave
- 1380 Pauline Dr
- 929 E El Camino Real Unit 138
- Rey Plan at 3131 Camino
- Asis Plan at 3131 Camino
- 981 Lorne Way
- 993 Lorne Way
- 986 Leighton Way
- 975 Lorne Way
- 980 Leighton Way
- 992 Leighton Way
- 999 Lorne Way
- 986 Lorne Way
- 974 Leighton Way
- 998 Leighton Way
- 980 Lorne Way
- 992 Lorne Way
- 969 Lorne Way
- 974 Lorne Way
- 998 Lorne Way
- 968 Leighton Way
- 968 Lorne Way
- 963 Lorne Way
- 987 Leighton Way
- 987 E Homestead Rd