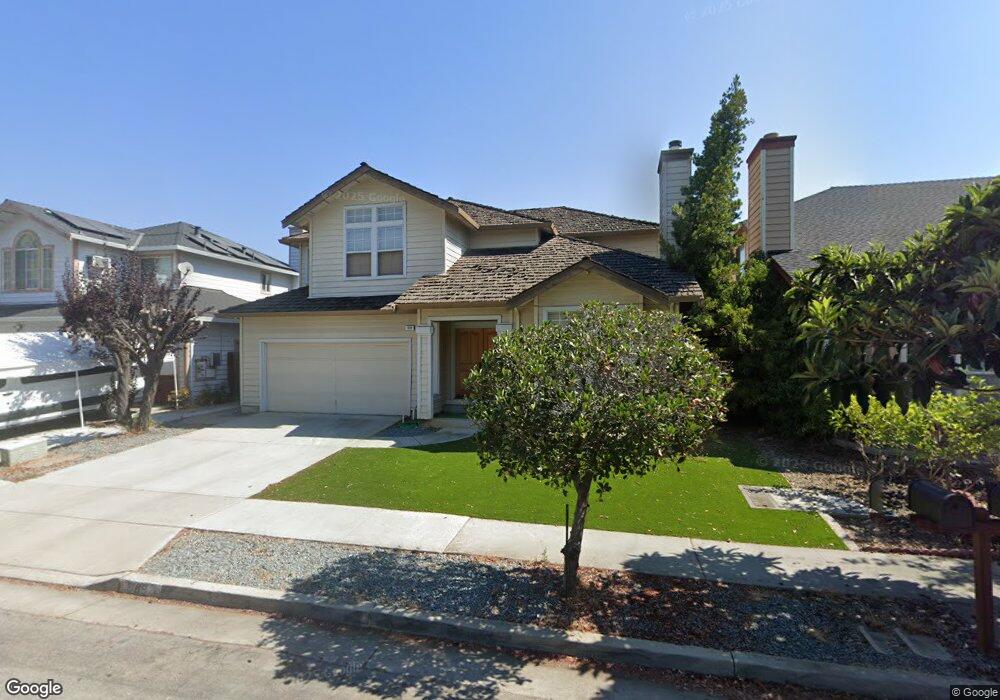
989 Dionne Way San Jose, CA 95133
Commodore NeighborhoodEstimated Value: $1,571,000 - $2,161,000
5
Beds
3
Baths
2,541
Sq Ft
$713/Sq Ft
Est. Value
About This Home
This home is located at 989 Dionne Way, San Jose, CA 95133 and is currently estimated at $1,812,831, approximately $713 per square foot. 989 Dionne Way is a home located in Santa Clara County with nearby schools including Vinci Park Elementary School, Piedmont Middle School, and Independence High School.
Ownership History
Date
Name
Owned For
Owner Type
Purchase Details
Closed on
Sep 23, 2017
Sold by
Han Ling Kung Chiang
Bought by
Chiang Yi
Current Estimated Value
Purchase Details
Closed on
Aug 9, 2002
Sold by
Chiang Yi
Bought by
Chiang Yi and Han Ling Kung Chiang
Home Financials for this Owner
Home Financials are based on the most recent Mortgage that was taken out on this home.
Original Mortgage
$190,000
Interest Rate
6.51%
Purchase Details
Closed on
Mar 11, 1998
Sold by
Chiang Rue Lin
Bought by
Chiang Yi
Home Financials for this Owner
Home Financials are based on the most recent Mortgage that was taken out on this home.
Original Mortgage
$198,000
Interest Rate
7.02%
Purchase Details
Closed on
Mar 12, 1996
Sold by
Tse Michael
Bought by
Chiang Yi and Chiang Rue Lin
Home Financials for this Owner
Home Financials are based on the most recent Mortgage that was taken out on this home.
Original Mortgage
$200,000
Interest Rate
7.05%
Purchase Details
Closed on
Dec 5, 1994
Sold by
Tse Geraldine
Bought by
Tse Michael
Create a Home Valuation Report for This Property
The Home Valuation Report is an in-depth analysis detailing your home's value as well as a comparison with similar homes in the area
Home Values in the Area
Average Home Value in this Area
Purchase History
| Date | Buyer | Sale Price | Title Company |
|---|---|---|---|
| Chiang Yi | -- | None Available | |
| Chiang Yi | $95,000 | Chicago Title | |
| Han Ling Kung Chiang | -- | Chicago Title | |
| Chiang Yi | $99,000 | Chicago Title Co | |
| Chiang Yi | $328,000 | North American Title Co | |
| Tse Michael | -- | -- |
Source: Public Records
Mortgage History
| Date | Status | Borrower | Loan Amount |
|---|---|---|---|
| Previous Owner | Chiang Yi | $190,000 | |
| Previous Owner | Chiang Yi | $198,000 | |
| Previous Owner | Chiang Yi | $200,000 |
Source: Public Records
Tax History Compared to Growth
Tax History
| Year | Tax Paid | Tax Assessment Tax Assessment Total Assessment is a certain percentage of the fair market value that is determined by local assessors to be the total taxable value of land and additions on the property. | Land | Improvement |
|---|---|---|---|---|
| 2025 | $8,206 | $544,867 | $182,722 | $362,145 |
| 2024 | $8,206 | $534,185 | $179,140 | $355,045 |
| 2023 | $8,044 | $523,712 | $175,628 | $348,084 |
| 2022 | $8,007 | $513,444 | $172,185 | $341,259 |
| 2021 | $7,734 | $503,377 | $168,809 | $334,568 |
| 2020 | $7,485 | $498,217 | $167,079 | $331,138 |
| 2019 | $7,197 | $488,449 | $163,803 | $324,646 |
| 2018 | $7,089 | $478,873 | $160,592 | $318,281 |
| 2017 | $7,120 | $469,485 | $157,444 | $312,041 |
| 2016 | $6,822 | $460,280 | $154,357 | $305,923 |
| 2015 | $6,739 | $453,367 | $152,039 | $301,328 |
| 2014 | $6,108 | $444,487 | $149,061 | $295,426 |
Source: Public Records
Map
Nearby Homes
- 1049 Branbury Way
- 2044 Voss Park Ln
- 1087 Yarrow Terrace
- 1055 Thyme Walkway
- 1713 Winston St
- 1957 Cape Horn Dr
- 1146 Rosebriar Way
- 1137 Mallow Terrace
- 1824 Seville Way
- 2324 Mossdale Way
- 2328 Mossdale Way
- 2109 Kiwi Walkway
- 832 N Jackson Ave
- 12280 Mabury Rd
- 1210 Briarcreek Ct
- 1809 Sageland Dr
- 1660 Solari Place
- 1027 Giacomo Ln Unit 7
- 1945 Galileo Ln
- 2369 Mabury Rd
- 987 Dionne Way
- 991 Dionne Way
- 984 Cape Jessup Dr
- 980 Cape Jessup Dr
- 985 Dionne Way
- 988 Cape Jessup Dr
- 993 Dionne Way
- 1906 Tiani Ct
- 1986 Tiani Ct
- 976 Cape Jessup Dr
- 992 Cape Jessup Dr
- 983 Dionne Way
- 1900 Tiani Ct
- 995 Dionne Way
- 1903 Tiani Ct
- 1885 Penwood St
- 972 Cape Jessup Dr
- 1897 Tiani Ct
- 996 Cape Jessup Dr
- 981 Dionne Way