Estimated Value: $119,951 - $139,000
3
Beds
2
Baths
784
Sq Ft
$168/Sq Ft
Est. Value
About This Home
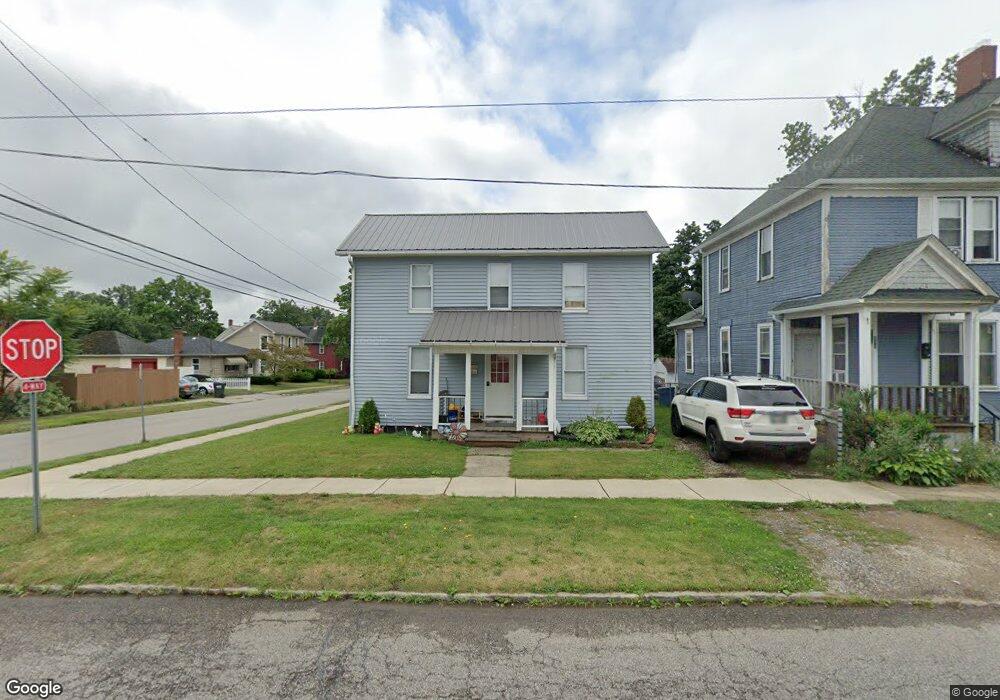
This home is located at 989 E 3rd St Unit STT, Salem, OH 44460 and is currently estimated at $131,488, approximately $167 per square foot. 989 E 3rd St Unit STT is a home located in Columbiana County with nearby schools including Reilly Elementary School, Buckeye Elementary School, and Salem Junior High School.
Ownership History
Date
Name
Owned For
Owner Type
Purchase Details
Closed on
May 25, 2023
Sold by
Javens William M
Bought by
Bonilla Dilcia
Current Estimated Value
Home Financials for this Owner
Home Financials are based on the most recent Mortgage that was taken out on this home.
Original Mortgage
$121,250
Outstanding Balance
$117,134
Interest Rate
6.27%
Mortgage Type
New Conventional
Estimated Equity
$14,354
Purchase Details
Closed on
Mar 4, 2021
Sold by
Slocum Mark and Slocum Sherri
Bought by
Javens William M
Purchase Details
Closed on
Jan 14, 2020
Sold by
Weaver Bruce
Bought by
Slocum Mark and Slocum Sherri
Purchase Details
Closed on
Jun 3, 1999
Sold by
Jamison Kevin L
Bought by
Weaver Bruce
Home Financials for this Owner
Home Financials are based on the most recent Mortgage that was taken out on this home.
Original Mortgage
$35,000
Interest Rate
6.99%
Create a Home Valuation Report for This Property
The Home Valuation Report is an in-depth analysis detailing your home's value as well as a comparison with similar homes in the area
Home Values in the Area
Average Home Value in this Area
Purchase History
| Date | Buyer | Sale Price | Title Company |
|---|---|---|---|
| Bonilla Dilcia | $125,000 | American Title | |
| Bonilla Dilcia | $125,000 | American Title | |
| Javens William M | $10,000 | None Available | |
| Slocum Mark | $9,967 | None Available | |
| Weaver Bruce | $33,000 | -- | |
| Jamison Kevin L | $18,000 | -- |
Source: Public Records
Mortgage History
| Date | Status | Borrower | Loan Amount |
|---|---|---|---|
| Open | Bonilla Dilcia | $121,250 | |
| Closed | Bonilla Dilcia | $121,250 | |
| Previous Owner | Weaver Bruce | $35,000 |
Source: Public Records
Tax History
| Year | Tax Paid | Tax Assessment Tax Assessment Total Assessment is a certain percentage of the fair market value that is determined by local assessors to be the total taxable value of land and additions on the property. | Land | Improvement |
|---|---|---|---|---|
| 2025 | $1,224 | $32,270 | $2,730 | $29,540 |
| 2024 | $1,082 | $26,890 | $2,280 | $24,610 |
| 2023 | $699 | $17,750 | $2,280 | $15,470 |
| 2022 | $646 | $17,750 | $2,280 | $15,470 |
| 2021 | $627 | $15,720 | $2,730 | $12,990 |
| 2020 | $1,904 | $15,720 | $2,730 | $12,990 |
| 2019 | $632 | $15,720 | $2,730 | $12,990 |
| 2018 | $602 | $14,290 | $2,490 | $11,800 |
| 2017 | $601 | $14,290 | $2,490 | $11,800 |
| 2016 | $626 | $14,110 | $3,010 | $11,100 |
| 2015 | $596 | $14,110 | $3,010 | $11,100 |
| 2014 | $677 | $14,110 | $3,010 | $11,100 |
Source: Public Records
Map
Nearby Homes
- 267 Hawley Ave
- 879 E 4th St
- 807 E 3rd St
- 1009 E 6th St
- 1273 E State St
- 512 N Union Ave
- 401 Highland Ave
- 245 Highland Ave
- 629 E 6th St
- 531 E School St
- 339 S Union Ave
- 427 S Union Ave
- 555 Columbia St
- 520 Walnut St
- 313 E 7th St
- 492 N Ellsworth Ave
- 246 E 7th St
- 930 Highland Ave
- 854 S Lincoln Ave
- 875 Homewood Ave
Your Personal Tour Guide
Ask me questions while you tour the home.