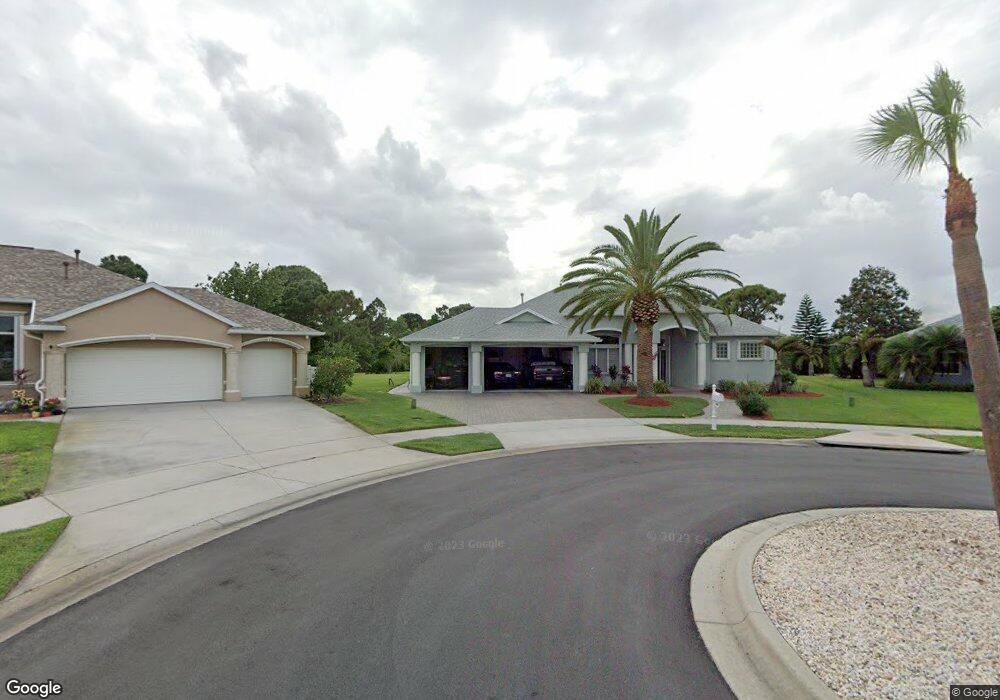
989 Warbler Ct Rockledge, FL 32955
Estimated Value: $590,000 - $658,000
3
Beds
3
Baths
2,209
Sq Ft
$281/Sq Ft
Est. Value
About This Home
This home is located at 989 Warbler Ct, Rockledge, FL 32955 and is currently estimated at $620,527, approximately $280 per square foot. 989 Warbler Ct is a home located in Brevard County with nearby schools including Ralph M. Williams Junior Elementary School, Ronald McNair Magnet Middle School, and Devereux School.
Ownership History
Date
Name
Owned For
Owner Type
Purchase Details
Closed on
Nov 8, 2022
Sold by
Roder Kenneth S and Ramirez-Roder Luz E
Bought by
Roder Kenneth S and Ramirez-Roder Luz E
Current Estimated Value
Purchase Details
Closed on
Oct 15, 2019
Sold by
Roder Kenneth S and Ramirez Luz E
Bought by
Roder Kenneth S and Ramirez Roser Luz E
Purchase Details
Closed on
Mar 8, 2013
Sold by
Roder Kenneth
Bought by
Hunt Doris J
Home Financials for this Owner
Home Financials are based on the most recent Mortgage that was taken out on this home.
Original Mortgage
$100,000
Interest Rate
3.43%
Purchase Details
Closed on
Sep 9, 2003
Sold by
Salgar Construction Co
Bought by
Roder Kenneth and Ramirez Luz
Home Financials for this Owner
Home Financials are based on the most recent Mortgage that was taken out on this home.
Original Mortgage
$240,000
Interest Rate
5.62%
Create a Home Valuation Report for This Property
The Home Valuation Report is an in-depth analysis detailing your home's value as well as a comparison with similar homes in the area
Home Values in the Area
Average Home Value in this Area
Purchase History
| Date | Buyer | Sale Price | Title Company |
|---|---|---|---|
| Roder Kenneth S | $100 | None Listed On Document | |
| Roder Kenneth S | $100 | None Listed On Document | |
| Roder Kenneth S | -- | None Available | |
| Hunt Doris J | $125,000 | Security First Title & Escro | |
| Roder Kenneth | $56,500 | -- | |
| Salgar Construction Co | $56,500 | -- |
Source: Public Records
Mortgage History
| Date | Status | Borrower | Loan Amount |
|---|---|---|---|
| Previous Owner | Hunt Doris J | $100,000 | |
| Previous Owner | Roder Kenneth | $240,000 |
Source: Public Records
Tax History
| Year | Tax Paid | Tax Assessment Tax Assessment Total Assessment is a certain percentage of the fair market value that is determined by local assessors to be the total taxable value of land and additions on the property. | Land | Improvement |
|---|---|---|---|---|
| 2025 | $4,122 | $285,230 | -- | -- |
| 2024 | $4,074 | $277,200 | -- | -- |
| 2023 | $4,074 | $269,130 | $0 | $0 |
| 2022 | $3,843 | $261,300 | $0 | $0 |
| 2021 | $4,052 | $253,690 | $0 | $0 |
| 2020 | $4,034 | $250,190 | $0 | $0 |
| 2019 | $3,986 | $244,570 | $0 | $0 |
| 2018 | $4,000 | $240,010 | $0 | $0 |
| 2017 | $4,039 | $235,080 | $0 | $0 |
| 2016 | $4,102 | $230,250 | $77,000 | $153,250 |
| 2015 | $4,195 | $228,650 | $77,000 | $151,650 |
| 2014 | $4,207 | $226,840 | $71,500 | $155,340 |
Source: Public Records
Map
Nearby Homes
- 5820 Herons Landing Dr
- 5911 Herons Landing Dr
- 6031 Herons Landing Dr
- 5731 Herons Landing Dr
- 840 Sandhill Crane Ct
- 1000 Starling Way
- 963 Brumpton Place
- 1430 Lago Mar Dr
- 1611 Lago Mar Dr
- 1471 Lago Mar Dr
- 1794 Sun Gazer Dr
- 1603 Tailfeather Ct
- 1671 Lago Mar Dr
- 1690 Lago Mar Dr
- 1790 Independence Ave
- 1188 Auburn Lakes Dr
- 1422 Keys Gate Dr
- 4640 Manchester Dr
- 2049 Tullagee Ave
- 2009 Tullagee Ave
- 979 Warbler Ct
- 978 Warbler Ct Unit 6B
- 969 Warbler Ct
- 968 Warbler Ct Unit 6B
- 5850 Herons Landing Dr
- 5900 Herons Landing Dr
- 5840 Herons Landing Dr Unit 6B
- 5920 Herons Landing Dr Unit 7
- 5930 Herons Landing Dr
- 5830 Herons Landing Dr
- 5861 Herons Landing Dr
- 5871 Herons Landing Dr Unit 6B
- 5851 Herons Landing Dr
- 5881 Herons Landing Dr Unit 6B
- 5940 Herons Landing Dr
- 5891 Herons Landing Dr
- 5841 Herons Landing Dr
- 5901 Herons Landing Dr
- 5831 Herons Landing Dr Unit 6B
- 5950 Herons Landing Dr
Your Personal Tour Guide
Ask me questions while you tour the home.