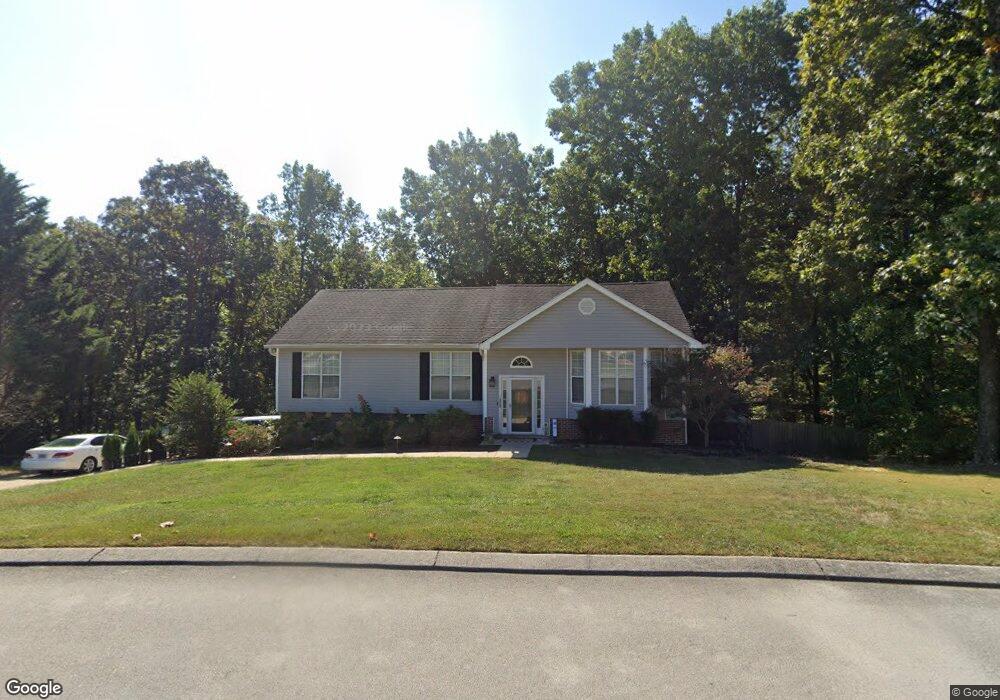
9895 Fielding Rd Ooltewah, TN 37363
Estimated Value: $347,000 - $391,000
5
Beds
2
Baths
1,999
Sq Ft
$181/Sq Ft
Est. Value
About This Home
This home is located at 9895 Fielding Rd, Ooltewah, TN 37363 and is currently estimated at $362,198, approximately $181 per square foot. 9895 Fielding Rd is a home located in Hamilton County with nearby schools including Wallace A. Smith Elementary School, Hunter Middle School, and Central High School.
Ownership History
Date
Name
Owned For
Owner Type
Purchase Details
Closed on
Oct 25, 2018
Sold by
Blakemore Michael A
Bought by
Blakemore Erin
Current Estimated Value
Home Financials for this Owner
Home Financials are based on the most recent Mortgage that was taken out on this home.
Original Mortgage
$100,000
Outstanding Balance
$87,930
Interest Rate
4.8%
Mortgage Type
Credit Line Revolving
Estimated Equity
$274,268
Purchase Details
Closed on
Aug 24, 2004
Sold by
Jahn Richard P and Dondero Kristen Lee
Bought by
Blakemore Michael A
Home Financials for this Owner
Home Financials are based on the most recent Mortgage that was taken out on this home.
Original Mortgage
$111,950
Interest Rate
5.96%
Mortgage Type
Unknown
Purchase Details
Closed on
Jul 20, 2001
Sold by
Bell Engineering Company Inc
Bought by
Dondero Kristen
Home Financials for this Owner
Home Financials are based on the most recent Mortgage that was taken out on this home.
Original Mortgage
$116,400
Interest Rate
7.08%
Create a Home Valuation Report for This Property
The Home Valuation Report is an in-depth analysis detailing your home's value as well as a comparison with similar homes in the area
Home Values in the Area
Average Home Value in this Area
Purchase History
| Date | Buyer | Sale Price | Title Company |
|---|---|---|---|
| Blakemore Erin | -- | None Available | |
| Blakemore Michael A | $139,999 | First Title | |
| Dondero Kristen | $120,000 | Pioneer Title Agency Inc | |
| Bell Engineering Company Inc | -- | Pioneer Title Agency Inc |
Source: Public Records
Mortgage History
| Date | Status | Borrower | Loan Amount |
|---|---|---|---|
| Open | Blakemore Erin | $100,000 | |
| Closed | Blakemore Michael A | $111,950 | |
| Previous Owner | Dondero Kristen | $116,400 | |
| Closed | Blakemore Michael A | $28,000 |
Source: Public Records
Tax History Compared to Growth
Tax History
| Year | Tax Paid | Tax Assessment Tax Assessment Total Assessment is a certain percentage of the fair market value that is determined by local assessors to be the total taxable value of land and additions on the property. | Land | Improvement |
|---|---|---|---|---|
| 2024 | $1,166 | $52,125 | $0 | $0 |
| 2023 | $1,175 | $52,125 | $0 | $0 |
| 2022 | $1,175 | $52,125 | $0 | $0 |
| 2021 | $1,175 | $52,125 | $0 | $0 |
| 2020 | $1,134 | $40,675 | $0 | $0 |
| 2019 | $1,134 | $40,675 | $0 | $0 |
| 2018 | $1,134 | $40,675 | $0 | $0 |
| 2017 | $1,134 | $40,675 | $0 | $0 |
| 2016 | $1,084 | $0 | $0 | $0 |
| 2015 | $1,084 | $38,875 | $0 | $0 |
| 2014 | $1,084 | $0 | $0 | $0 |
Source: Public Records
Map
Nearby Homes
- 9910 Fielding Rd
- 6601 Flagstone Dr
- 5916 Riley Rd
- 6015 Parsons Pond Dr
- 4110 Flagway Dr
- 7118 Flagstone Dr
- 7215 Flagstone Dr
- 6920 Knollcrest Dr
- 6815 Benwood Dr
- 6442 Veronica Dr
- 5311 Kellys Point
- 0 Lodestone Dr
- 6898 Bucksland Dr
- 6307 Jan Lane Dr
- 7205 Flagstone Dr
- 5586 Crooked Creek Dr
- 7015 Lystra Rd
- 7356 Landlock Dr
- 5864 Crooked Creek Dr
- 6183 Gibbs Ln
- 10005 Fielding Rd
- 9873 Fielding Rd
- 9961 Fielding Rd
- 10023 Fielding Rd
- 9892 Fielding Rd
- 10057 Fielding Rd
- 6530 Burl Ln
- 9926 Fielding Rd
- 9926 Fielding Rd Unit 523
- 10081 Fielding Rd
- 6507 Burl Ln
- 9818 Fielding Rd
- 5903 Chandler Hill Rd
- 5903 Chandler Hill Rd Unit 523
- 10095 Fielding Rd
- 6531 Burl Ln
- 6558 Burl Ln
- 6558 Burl Ln Unit 468
- 10115 Fielding Rd
- 9942 Fielding Rd