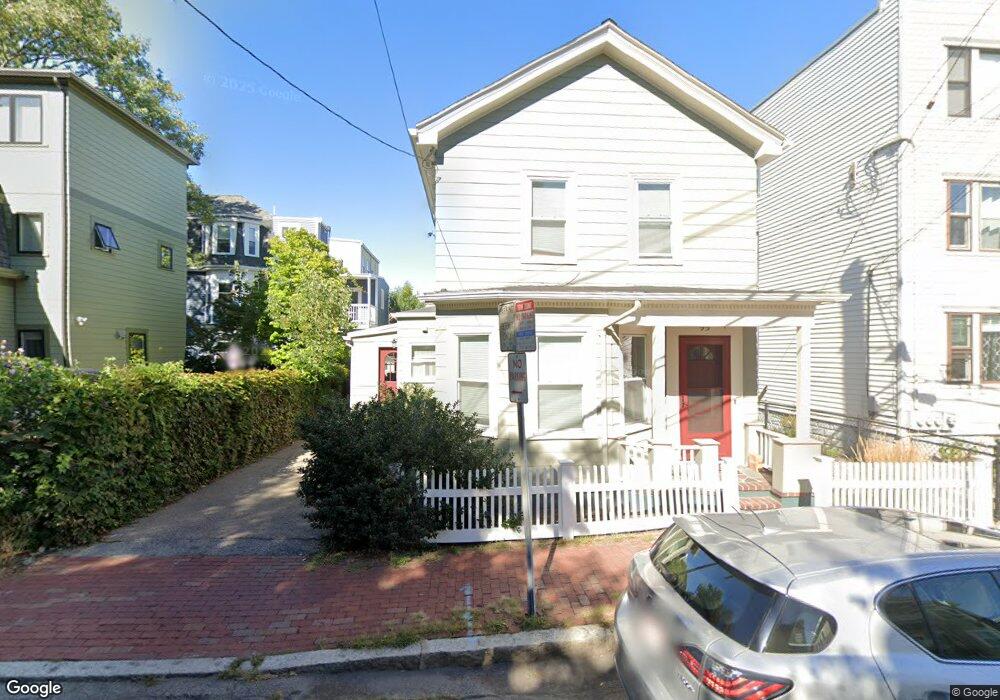
99 Allston St Cambridge, MA 02139
Cambridgeport NeighborhoodEstimated Value: $1,411,000 - $1,730,017
3
Beds
2
Baths
1,278
Sq Ft
$1,223/Sq Ft
Est. Value
About This Home
This home is located at 99 Allston St, Cambridge, MA 02139 and is currently estimated at $1,563,254, approximately $1,223 per square foot. 99 Allston St is a home located in Middlesex County with nearby schools including Prospect Hill Academy Charter School, New England Hebrew Academy, and Boston University Academy.
Ownership History
Date
Name
Owned For
Owner Type
Purchase Details
Closed on
Apr 1, 2025
Sold by
Carretta Ruth A
Bought by
Carretta Ruth A and Salamanca Carlos
Current Estimated Value
Purchase Details
Closed on
May 11, 2007
Sold by
Tokarcik Edward C
Bought by
Salamanca Carlos and Carretta Ruth A
Home Financials for this Owner
Home Financials are based on the most recent Mortgage that was taken out on this home.
Original Mortgage
$260,000
Interest Rate
6.21%
Mortgage Type
Purchase Money Mortgage
Purchase Details
Closed on
Aug 30, 2006
Sold by
Pierce Charles M
Bought by
Tokarcik Edward C
Home Financials for this Owner
Home Financials are based on the most recent Mortgage that was taken out on this home.
Original Mortgage
$338,000
Interest Rate
6.83%
Mortgage Type
Purchase Money Mortgage
Purchase Details
Closed on
Jul 25, 1988
Sold by
Schaum Patricia
Bought by
Pierce Charles M
Create a Home Valuation Report for This Property
The Home Valuation Report is an in-depth analysis detailing your home's value as well as a comparison with similar homes in the area
Home Values in the Area
Average Home Value in this Area
Purchase History
| Date | Buyer | Sale Price | Title Company |
|---|---|---|---|
| Carretta Ruth A | -- | None Available | |
| Carretta Ruth A | -- | None Available | |
| Carretta Ruth A | -- | None Available | |
| Carretta Ruth A | -- | None Available | |
| Salamanca Carlos | $635,000 | -- | |
| Salamanca Carlos | $635,000 | -- | |
| Tokarcik Edward C | $422,500 | -- | |
| Tokarcik Edward C | $422,500 | -- | |
| Pierce Charles M | $185,000 | -- |
Source: Public Records
Mortgage History
| Date | Status | Borrower | Loan Amount |
|---|---|---|---|
| Previous Owner | Pierce Charles M | $235,000 | |
| Previous Owner | Salamanca Carlos | $260,000 | |
| Previous Owner | Tokarcik Edward C | $338,000 |
Source: Public Records
Tax History Compared to Growth
Tax History
| Year | Tax Paid | Tax Assessment Tax Assessment Total Assessment is a certain percentage of the fair market value that is determined by local assessors to be the total taxable value of land and additions on the property. | Land | Improvement |
|---|---|---|---|---|
| 2025 | $9,044 | $1,424,300 | $813,500 | $610,800 |
| 2024 | $8,679 | $1,466,100 | $881,200 | $584,900 |
| 2023 | $8,066 | $1,376,500 | $872,300 | $504,200 |
| 2022 | $7,855 | $1,326,800 | $880,400 | $446,400 |
| 2021 | $7,320 | $1,251,200 | $832,100 | $419,100 |
| 2020 | $6,834 | $1,188,500 | $791,200 | $397,300 |
| 2019 | $6,225 | $1,048,000 | $690,100 | $357,900 |
| 2018 | $5,976 | $950,000 | $606,800 | $343,200 |
| 2017 | $5,955 | $917,600 | $594,900 | $322,700 |
| 2016 | $5,355 | $766,100 | $469,900 | $296,200 |
| 2015 | $5,282 | $675,400 | $410,500 | $264,900 |
| 2014 | $5,455 | $650,900 | $389,600 | $261,300 |
Source: Public Records
Map
Nearby Homes
- 131 Erie St Unit 3
- 131 Erie St
- 161 Hamilton St
- 174 Hamilton St
- 260 Sidney St Unit 3R
- 214 Allston St
- 125 Brookline St Unit 4
- 8 Watson St Unit 8
- 6-8 Watson St Unit 8
- 127 Auburn St
- 129 Auburn St
- 1 Jay St
- 73 River St Unit 4B
- 300 Franklin St Unit 5
- 300 Franklin St Unit 1
- 300 Franklin St Unit 2
- 53 Jay St Unit 2
- 2 Hingham St
- 12 Inman St Unit 55
- 149A Bishop Allen Unit A
- 99 Allston St Unit 1
- 95 Allston St Unit 3
- 95 Allston St Unit 2
- 95 Allston St Unit 1
- 95 Allston St Unit 1,95
- 238 Brookine St
- 238 Brookine St
- 238 Brookline St
- 238 Brookline St Unit 238
- 238 Brookline St
- 89 Allston St
- 89 Allston St Unit 2
- 89 Allston St Unit 3
- 232 Brookline St
- 232 Brookline St Unit 230-2
- 232 Brookline St Unit 2
- 232 Brookline St Unit 3
- 232 Brookline St Unit 1
- 232 Brookline St Unit 232
- 232 Brookline St Unit 4