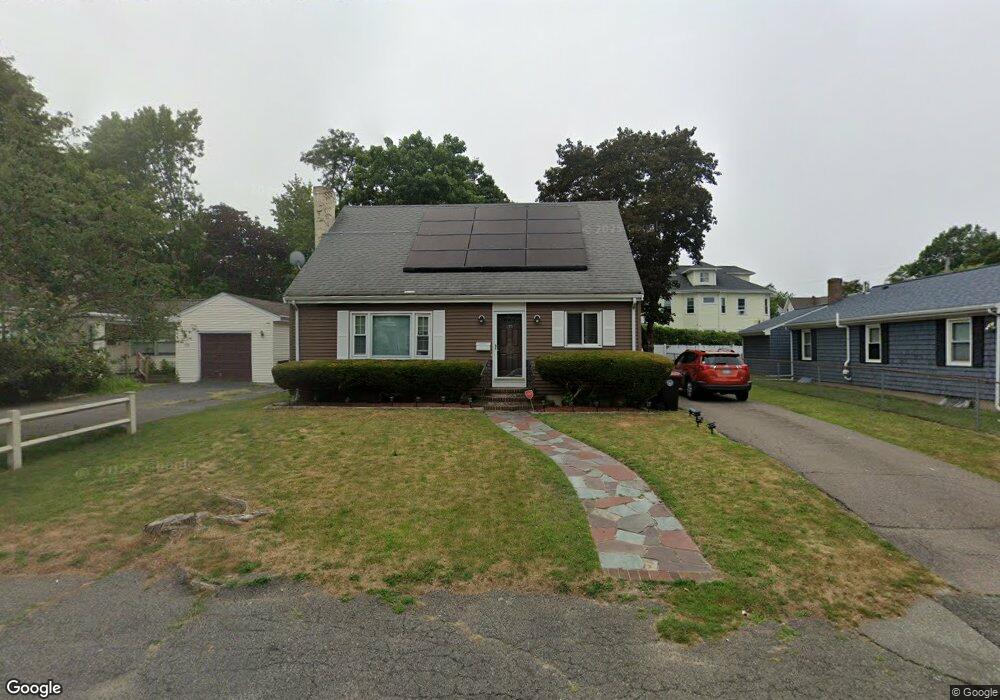
99 Ash St Brockton, MA 02301
Estimated Value: $445,000 - $487,611
3
Beds
1
Bath
1,142
Sq Ft
$410/Sq Ft
Est. Value
About This Home
This home is located at 99 Ash St, Brockton, MA 02301 and is currently estimated at $467,653, approximately $409 per square foot. 99 Ash St is a home located in Plymouth County with nearby schools including Louis F Angelo Elementary School, Raymond K-8 Elementary School, and Hancock Elementary School.
Ownership History
Date
Name
Owned For
Owner Type
Purchase Details
Closed on
May 18, 2007
Sold by
Boen James A
Bought by
Cambronne Betty
Current Estimated Value
Home Financials for this Owner
Home Financials are based on the most recent Mortgage that was taken out on this home.
Original Mortgage
$232,500
Outstanding Balance
$141,500
Interest Rate
6.18%
Mortgage Type
Purchase Money Mortgage
Estimated Equity
$326,153
Purchase Details
Closed on
Mar 19, 2007
Sold by
Greenblatt Arnold M and Greenblatt Myra
Bought by
Boen James A
Home Financials for this Owner
Home Financials are based on the most recent Mortgage that was taken out on this home.
Original Mortgage
$232,500
Outstanding Balance
$141,500
Interest Rate
6.18%
Mortgage Type
Purchase Money Mortgage
Estimated Equity
$326,153
Create a Home Valuation Report for This Property
The Home Valuation Report is an in-depth analysis detailing your home's value as well as a comparison with similar homes in the area
Home Values in the Area
Average Home Value in this Area
Purchase History
| Date | Buyer | Sale Price | Title Company |
|---|---|---|---|
| Cambronne Betty | $232,500 | -- | |
| Boen James A | $150,000 | -- |
Source: Public Records
Mortgage History
| Date | Status | Borrower | Loan Amount |
|---|---|---|---|
| Open | Boen James A | $232,500 | |
| Previous Owner | Boen James A | $39,553 |
Source: Public Records
Tax History Compared to Growth
Tax History
| Year | Tax Paid | Tax Assessment Tax Assessment Total Assessment is a certain percentage of the fair market value that is determined by local assessors to be the total taxable value of land and additions on the property. | Land | Improvement |
|---|---|---|---|---|
| 2025 | $4,423 | $365,200 | $138,900 | $226,300 |
| 2024 | $4,356 | $362,400 | $138,900 | $223,500 |
| 2023 | $4,479 | $345,100 | $103,400 | $241,700 |
| 2022 | $4,206 | $301,100 | $93,900 | $207,200 |
| 2021 | $3,880 | $267,600 | $77,800 | $189,800 |
| 2020 | $3,981 | $262,800 | $73,100 | $189,700 |
| 2019 | $3,947 | $254,000 | $71,100 | $182,900 |
| 2018 | $3,438 | $214,100 | $71,100 | $143,000 |
| 2017 | $3,156 | $196,000 | $71,100 | $124,900 |
| 2016 | $3,168 | $182,500 | $68,900 | $113,600 |
| 2015 | $3,033 | $167,100 | $68,900 | $98,200 |
| 2014 | $3,031 | $167,200 | $68,900 | $98,300 |
Source: Public Records
Map
Nearby Homes