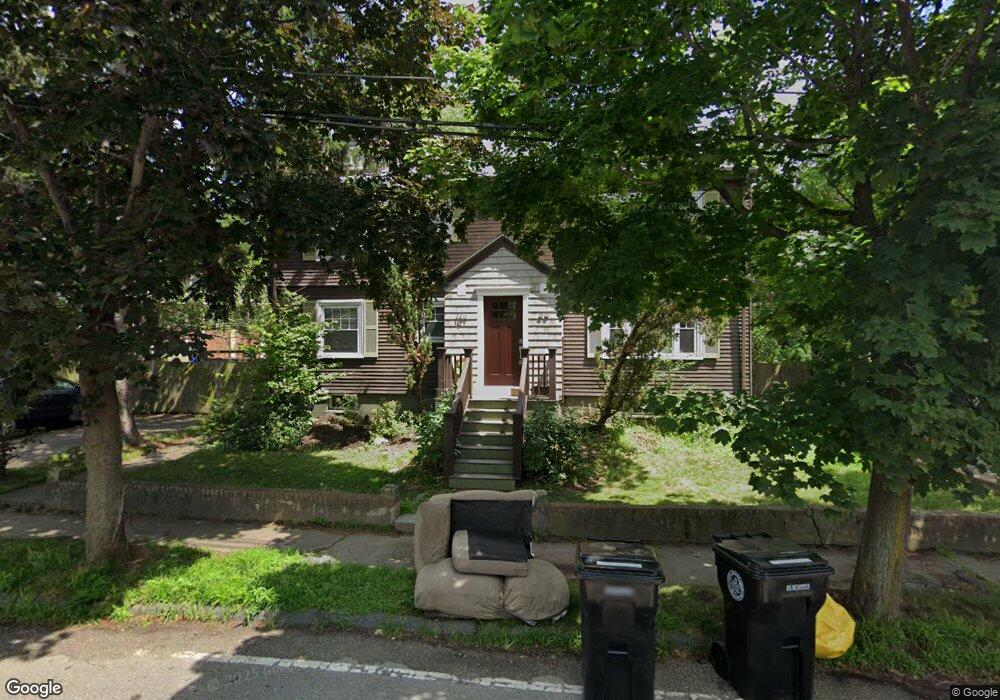
99 Baker St Unit 101 Belmont, MA 02478
Belmont Center NeighborhoodEstimated Value: $1,152,000 - $2,063,856
7
Beds
4
Baths
3,003
Sq Ft
$515/Sq Ft
Est. Value
About This Home
This home is located at 99 Baker St Unit 101, Belmont, MA 02478 and is currently estimated at $1,546,214, approximately $514 per square foot. 99 Baker St Unit 101 is a home located in Middlesex County with nearby schools including Mary Lee Burbank Elementary School, Winthrop L Chenery Middle School, and Belmont High School.
Ownership History
Date
Name
Owned For
Owner Type
Purchase Details
Closed on
Jul 28, 1997
Sold by
Fonte Joseph C and Fonte Lina
Bought by
Manning Sarah H
Current Estimated Value
Home Financials for this Owner
Home Financials are based on the most recent Mortgage that was taken out on this home.
Original Mortgage
$204,000
Interest Rate
7.7%
Mortgage Type
Purchase Money Mortgage
Create a Home Valuation Report for This Property
The Home Valuation Report is an in-depth analysis detailing your home's value as well as a comparison with similar homes in the area
Home Values in the Area
Average Home Value in this Area
Purchase History
| Date | Buyer | Sale Price | Title Company |
|---|---|---|---|
| Manning Sarah H | $304,000 | -- |
Source: Public Records
Mortgage History
| Date | Status | Borrower | Loan Amount |
|---|---|---|---|
| Open | Manning Sarah H | $204,000 | |
| Closed | Manning Sarah H | $204,000 |
Source: Public Records
Tax History Compared to Growth
Tax History
| Year | Tax Paid | Tax Assessment Tax Assessment Total Assessment is a certain percentage of the fair market value that is determined by local assessors to be the total taxable value of land and additions on the property. | Land | Improvement |
|---|---|---|---|---|
| 2025 | $19,807 | $1,739,000 | $847,000 | $892,000 |
| 2024 | $15,238 | $1,443,000 | $845,000 | $598,000 |
| 2023 | $15,590 | $1,387,000 | $847,000 | $540,000 |
| 2022 | $15,775 | $1,136,000 | $729,000 | $407,000 |
| 2021 | $15,775 | $1,367,000 | $947,000 | $420,000 |
| 2020 | $12,727 | $1,157,000 | $758,000 | $399,000 |
| 2019 | $10,491 | $899,000 | $496,000 | $403,000 |
| 2018 | $9,975 | $821,000 | $425,000 | $396,000 |
| 2017 | $9,924 | $782,000 | $390,000 | $392,000 |
| 2016 | $9,646 | $768,000 | $380,000 | $388,000 |
| 2015 | $8,901 | $690,000 | $338,000 | $352,000 |
Source: Public Records
Map
Nearby Homes
- 73 Trowbridge St Unit 73A
- 73 Trowbridge St Unit 73B
- 48 Hamilton Rd
- 46 Hamilton Rd
- 55 S Normandy Ave
- 93 Griswold St Unit 93
- 95 Griswold St Unit 95
- 4 Merrill Ave
- 48 Concord Ave
- 63 Loomis St Unit 63
- 105 Watson Rd
- 248 School St
- 38 Myrtle St
- 1 Spinney Terrace
- 242 Claflin St
- 200 Claflin St
- 66 Channing Rd
- 31 Mott St Unit 31A
- 137-139 Thorndike St Unit 2
- 128 Thorndike St Unit 128A
- 91 Baker St
- 92 Baker St Unit 94
- 94 Baker St Unit 2
- 94 Baker St
- 92 Baker St Unit 1
- 94 Baker St Unit 94
- 92 Baker St Unit 92
- 87 Baker St Unit 89
- 87 Baker St Unit 1
- 16-18 Brighton St
- 89 Baker St
- 26 Brighton St Unit 205
- 26 Brighton St Unit 315
- 26 Brighton St Unit 202
- 63 Hittinger St Unit 65
- 63 Hittinger St Unit 63
- 12 Brighton St
- 88 Baker St
- 65 Hittinger St Unit 65
- 65 Hittinger St Unit Right