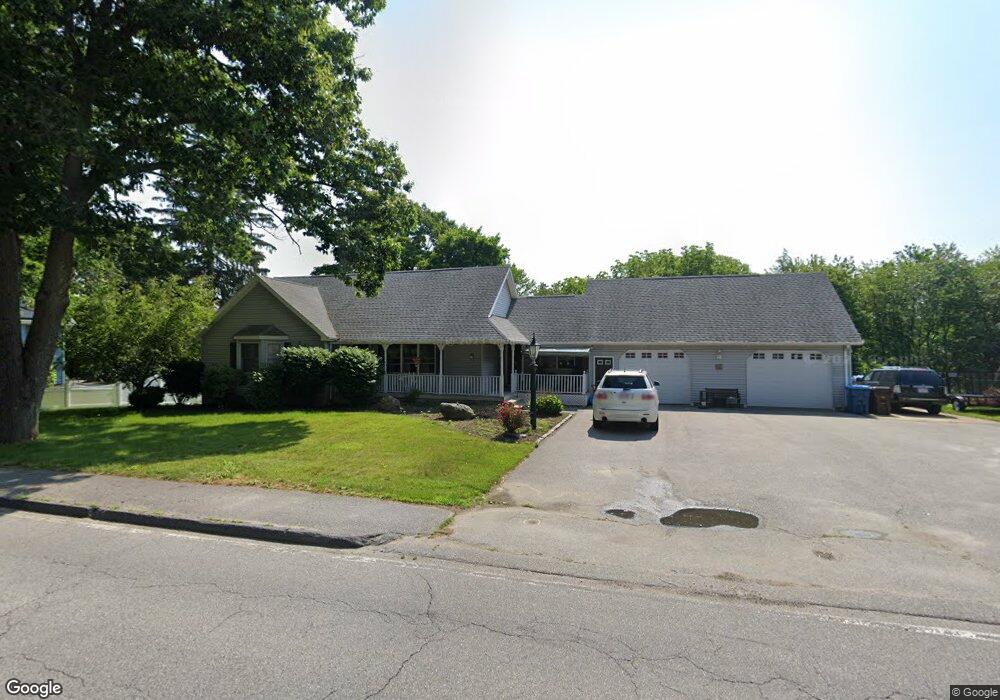
99 Boyce St Auburn, MA 01501
Stoneville NeighborhoodEstimated Value: $506,595 - $557,000
2
Beds
3
Baths
1,570
Sq Ft
$334/Sq Ft
Est. Value
About This Home
This home is located at 99 Boyce St, Auburn, MA 01501 and is currently estimated at $524,149, approximately $333 per square foot. 99 Boyce St is a home located in Worcester County with nearby schools including Auburn Senior High School, St Peter Central Catholic Elementary School, and Saint Paul Diocesan Junior-Senior High School.
Ownership History
Date
Name
Owned For
Owner Type
Purchase Details
Closed on
Sep 6, 2018
Sold by
D J Joslyn Sr 2011 Irt
Bought by
Joslyn Daniel T and Flink Elizabeth A
Current Estimated Value
Home Financials for this Owner
Home Financials are based on the most recent Mortgage that was taken out on this home.
Original Mortgage
$224,000
Outstanding Balance
$194,939
Interest Rate
4.5%
Mortgage Type
New Conventional
Estimated Equity
$329,210
Purchase Details
Closed on
May 9, 2013
Sold by
Joslyn Donald J
Bought by
Donald J Joslyn Sr Irt and Joslyn Donald J
Create a Home Valuation Report for This Property
The Home Valuation Report is an in-depth analysis detailing your home's value as well as a comparison with similar homes in the area
Home Values in the Area
Average Home Value in this Area
Purchase History
| Date | Buyer | Sale Price | Title Company |
|---|---|---|---|
| Joslyn Daniel T | $280,000 | -- | |
| Donald J Joslyn Sr Irt | -- | -- |
Source: Public Records
Mortgage History
| Date | Status | Borrower | Loan Amount |
|---|---|---|---|
| Open | Joslyn Daniel T | $224,000 |
Source: Public Records
Tax History Compared to Growth
Tax History
| Year | Tax Paid | Tax Assessment Tax Assessment Total Assessment is a certain percentage of the fair market value that is determined by local assessors to be the total taxable value of land and additions on the property. | Land | Improvement |
|---|---|---|---|---|
| 2025 | $70 | $487,700 | $116,800 | $370,900 |
| 2024 | $7,011 | $469,600 | $112,200 | $357,400 |
| 2023 | $6,749 | $425,000 | $102,000 | $323,000 |
| 2022 | $6,202 | $368,700 | $102,000 | $266,700 |
| 2021 | $6,126 | $337,700 | $90,100 | $247,600 |
| 2020 | $0 | $336,800 | $90,100 | $246,700 |
| 2019 | $5,681 | $308,400 | $89,300 | $219,100 |
| 2018 | $0 | $300,500 | $83,500 | $217,000 |
| 2017 | $3,116 | $292,800 | $75,800 | $217,000 |
| 2016 | $5,121 | $283,100 | $78,300 | $204,800 |
| 2015 | $4,862 | $281,700 | $78,300 | $203,400 |
| 2014 | $4,435 | $256,500 | $74,600 | $181,900 |
Source: Public Records
Map
Nearby Homes