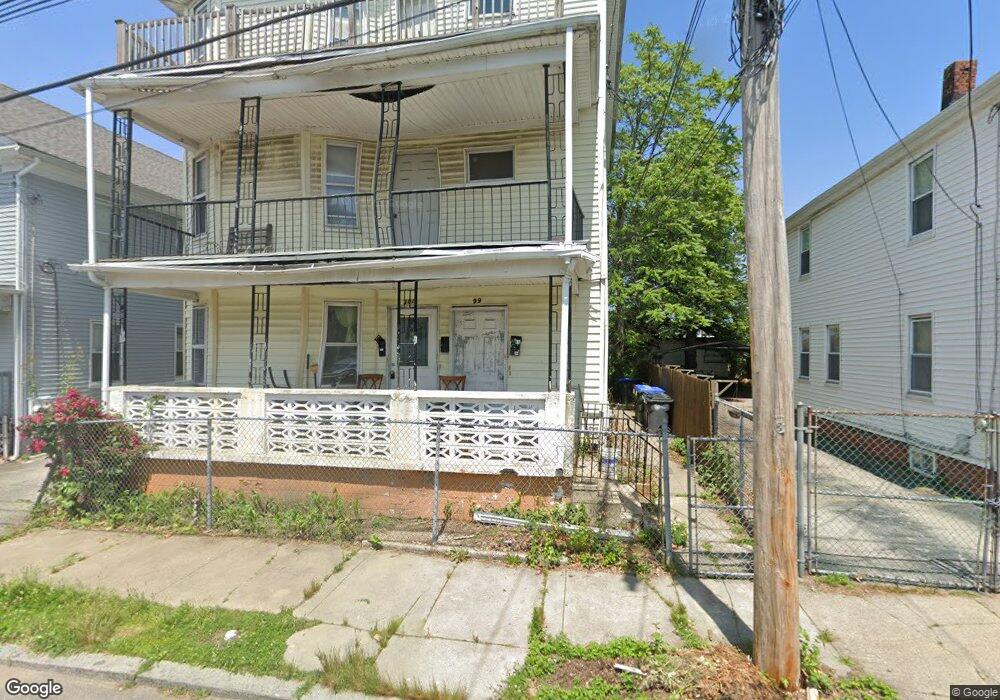
99 Cass St Providence, RI 02905
Washington Park NeighborhoodEstimated Value: $480,436 - $672,000
6
Beds
3
Baths
3,264
Sq Ft
$177/Sq Ft
Est. Value
About This Home
This home is located at 99 Cass St, Providence, RI 02905 and is currently estimated at $576,109, approximately $176 per square foot. 99 Cass St is a home located in Providence County with nearby schools including Asa Messer Elementary School, Charles N. Fortes Elementary School, and Alan Shawn Feinstein Elementary.
Ownership History
Date
Name
Owned For
Owner Type
Purchase Details
Closed on
Jun 1, 2018
Sold by
Payamps Jose and Valdez Marla
Bought by
Payamps Jose
Current Estimated Value
Home Financials for this Owner
Home Financials are based on the most recent Mortgage that was taken out on this home.
Original Mortgage
$167,590
Outstanding Balance
$99,295
Interest Rate
4.4%
Mortgage Type
New Conventional
Estimated Equity
$476,814
Purchase Details
Closed on
Sep 22, 1989
Sold by
Soewng Saro
Bought by
Thack Thua
Home Financials for this Owner
Home Financials are based on the most recent Mortgage that was taken out on this home.
Original Mortgage
$101,700
Interest Rate
9.82%
Mortgage Type
Purchase Money Mortgage
Create a Home Valuation Report for This Property
The Home Valuation Report is an in-depth analysis detailing your home's value as well as a comparison with similar homes in the area
Home Values in the Area
Average Home Value in this Area
Purchase History
| Date | Buyer | Sale Price | Title Company |
|---|---|---|---|
| Payamps Jose | -- | -- | |
| Thack Thua | $113,000 | -- |
Source: Public Records
Mortgage History
| Date | Status | Borrower | Loan Amount |
|---|---|---|---|
| Open | Payamps Jose | $167,590 | |
| Previous Owner | Thack Thua | $200,000 | |
| Previous Owner | Thack Thua | $101,700 |
Source: Public Records
Tax History Compared to Growth
Tax History
| Year | Tax Paid | Tax Assessment Tax Assessment Total Assessment is a certain percentage of the fair market value that is determined by local assessors to be the total taxable value of land and additions on the property. | Land | Improvement |
|---|---|---|---|---|
| 2025 | $3,989 | $528,300 | $120,000 | $408,300 |
| 2024 | $6,334 | $345,200 | $76,000 | $269,200 |
| 2023 | $6,334 | $345,200 | $76,000 | $269,200 |
| 2022 | $6,145 | $345,200 | $76,000 | $269,200 |
| 2021 | $4,630 | $188,500 | $33,600 | $154,900 |
| 2020 | $4,630 | $188,500 | $33,600 | $154,900 |
| 2019 | $4,630 | $188,500 | $33,600 | $154,900 |
| 2018 | $3,640 | $113,900 | $30,500 | $83,400 |
| 2017 | $3,640 | $113,900 | $30,500 | $83,400 |
| 2016 | $3,640 | $113,900 | $30,500 | $83,400 |
| 2015 | $3,201 | $96,700 | $30,500 | $66,200 |
| 2014 | $3,264 | $96,700 | $30,500 | $66,200 |
| 2013 | $3,264 | $96,700 | $30,500 | $66,200 |
Source: Public Records
Map
Nearby Homes