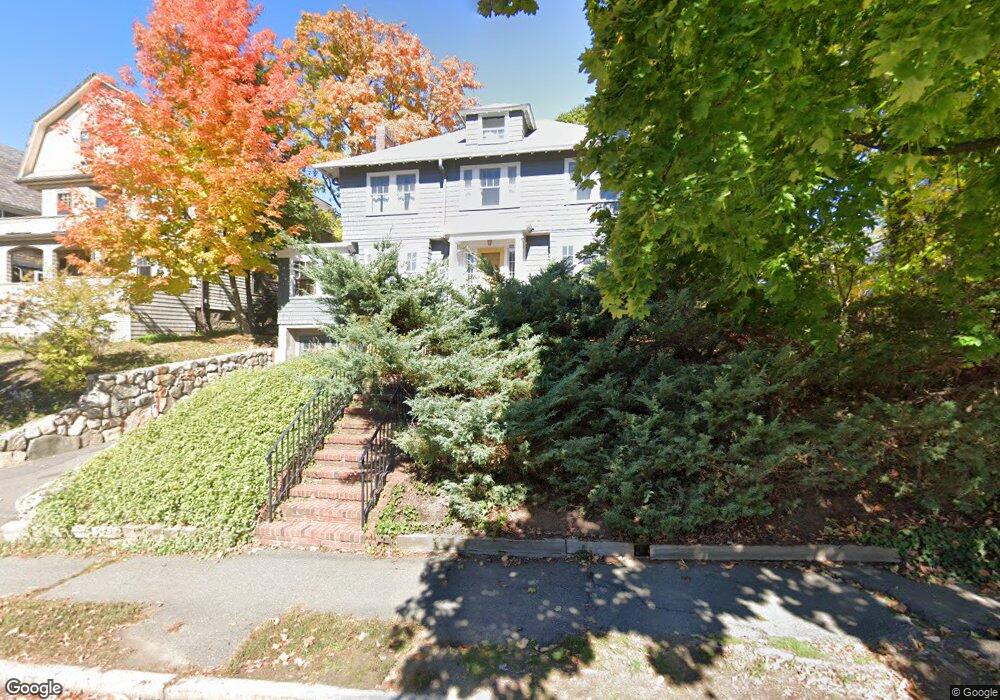
99 Colbourne Crescent Brookline, MA 02445
Washington Square NeighborhoodEstimated Value: $1,871,801 - $2,849,000
4
Beds
3
Baths
2,078
Sq Ft
$1,126/Sq Ft
Est. Value
About This Home
This home is located at 99 Colbourne Crescent, Brookline, MA 02445 and is currently estimated at $2,339,950, approximately $1,126 per square foot. 99 Colbourne Crescent is a home located in Norfolk County with nearby schools including John D. Runkle School, Torah Academy, and St. Mary of the Assumption Elementary School.
Ownership History
Date
Name
Owned For
Owner Type
Purchase Details
Closed on
Aug 24, 1976
Bought by
Manaras John T and Manaras Susan Y
Current Estimated Value
Create a Home Valuation Report for This Property
The Home Valuation Report is an in-depth analysis detailing your home's value as well as a comparison with similar homes in the area
Home Values in the Area
Average Home Value in this Area
Purchase History
| Date | Buyer | Sale Price | Title Company |
|---|---|---|---|
| Manaras John T | $61,500 | -- |
Source: Public Records
Mortgage History
| Date | Status | Borrower | Loan Amount |
|---|---|---|---|
| Closed | Manaras John T | $75,000 | |
| Closed | Manaras John T | $100,000 |
Source: Public Records
Tax History Compared to Growth
Tax History
| Year | Tax Paid | Tax Assessment Tax Assessment Total Assessment is a certain percentage of the fair market value that is determined by local assessors to be the total taxable value of land and additions on the property. | Land | Improvement |
|---|---|---|---|---|
| 2025 | $19,394 | $1,964,900 | $1,416,000 | $548,900 |
| 2024 | $18,464 | $1,889,900 | $1,361,600 | $528,300 |
| 2023 | $16,787 | $1,683,800 | $1,127,500 | $556,300 |
| 2022 | $16,341 | $1,603,600 | $1,073,800 | $529,800 |
| 2021 | $15,112 | $1,542,000 | $1,032,500 | $509,500 |
| 2020 | $13,617 | $1,440,900 | $938,600 | $502,300 |
| 2019 | $12,858 | $1,372,300 | $893,900 | $478,400 |
| 2018 | $11,504 | $1,216,100 | $745,900 | $470,200 |
| 2017 | $11,189 | $1,132,500 | $703,800 | $428,700 |
| 2016 | $12,285 | $1,179,000 | $657,700 | $521,300 |
| 2015 | $11,171 | $1,046,000 | $558,800 | $487,200 |
| 2014 | $11,242 | $987,000 | $507,800 | $479,200 |
Source: Public Records
Map
Nearby Homes
- 90 Addington Rd Unit 1
- 255 Tappan St
- 108-116 Winthrop Rd
- 15 Colbourne Crescent Unit 2
- 184 Rawson Rd
- 12 Colbourne Crescent Unit 1
- 84 Winthrop Rd Unit 1
- 84 Winthrop Rd
- 57 University Rd Unit 3
- 16 Garrison Rd Unit 7
- 648 Washington St Unit 7
- 324 Tappan St Unit 1
- 324 Tappan St Unit 2
- 94 Beaconsfield Rd Unit 201
- 4 Fairbanks St Unit 2
- 589-591 Washington St
- 105 Sumner Rd
- 333 Clark Rd
- 1731 Beacon St Unit 717
- 1731 Beacon St Unit 1502
- 103 Colbourne Crescent Unit 105
- 103 Colbourne Crescent
- 103 Colbourne Crescent Unit 2
- 105 Colbourne Crescent Unit 1
- 105 Colbourne Crescent Unit 2
- 103-105 Colbourne Crescent
- 93 Colbourne Crescent
- 107 Colbourne Crescent Unit 109
- 135 Addington Rd
- 77 Addington Rd
- 77 Addington Rd Unit 2
- 77 Addington Rd Unit 1
- 129 Addington Rd
- 100 Colbourne Crescent
- 113 Colbourne Crescent Unit 115
- 106 Colbourne Crescent
- 133 Rawson Rd
- 71 Addington Rd
- 69 Addington Rd
- 139 Rawson Rd