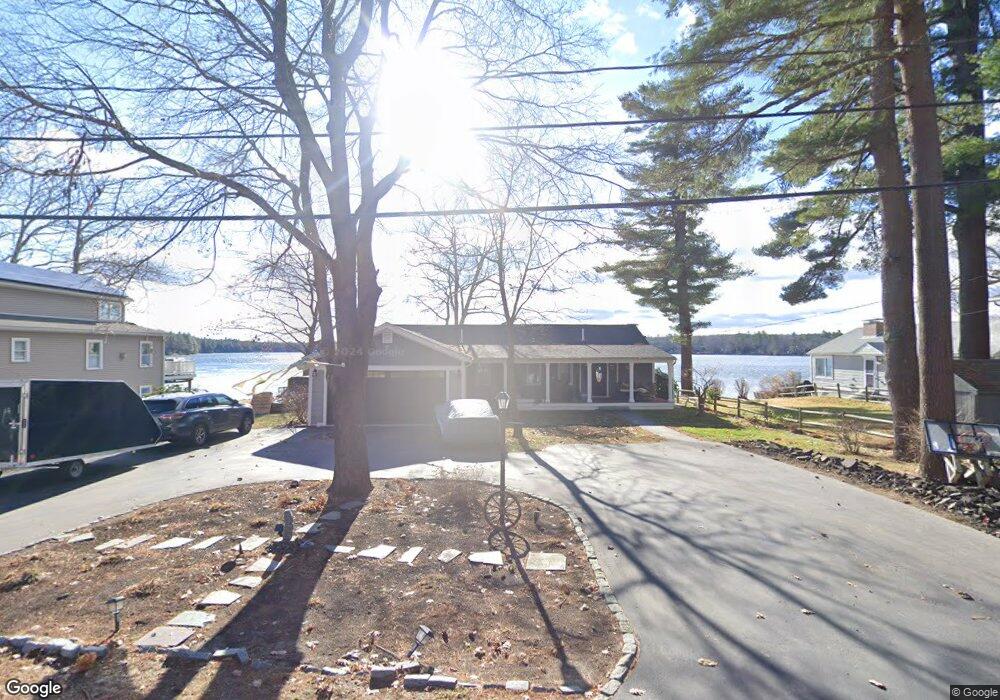
99 Cottage Rd Windham, ME 04062
Estimated Value: $628,000 - $813,000
3
Beds
3
Baths
1,594
Sq Ft
$464/Sq Ft
Est. Value
About This Home
This home is located at 99 Cottage Rd, Windham, ME 04062 and is currently estimated at $739,141, approximately $463 per square foot. 99 Cottage Rd is a home located in Cumberland County with nearby schools including Windham Primary School, Manchester School, and Windham Middle School.
Ownership History
Date
Name
Owned For
Owner Type
Purchase Details
Closed on
Mar 12, 2021
Sold by
Decosta Timothy W and Decosta Cynthia W
Bought by
Mavor Brian
Current Estimated Value
Purchase Details
Closed on
May 8, 2013
Sold by
Robert S Ordway Cred Sh T
Bought by
Mavor Brian P
Purchase Details
Closed on
Dec 30, 2008
Sold by
Johnston Dara D
Bought by
Ordway Anne W and Ordway David
Purchase Details
Closed on
Sep 14, 2005
Sold by
Rouse Leonard D
Bought by
Johnston Dara D
Home Financials for this Owner
Home Financials are based on the most recent Mortgage that was taken out on this home.
Original Mortgage
$228,000
Interest Rate
5%
Mortgage Type
Adjustable Rate Mortgage/ARM
Create a Home Valuation Report for This Property
The Home Valuation Report is an in-depth analysis detailing your home's value as well as a comparison with similar homes in the area
Home Values in the Area
Average Home Value in this Area
Purchase History
| Date | Buyer | Sale Price | Title Company |
|---|---|---|---|
| Mavor Brian | -- | None Available | |
| Mavor Brian P | -- | -- | |
| Ordway Anne W | -- | -- | |
| Johnston Dara D | -- | -- |
Source: Public Records
Mortgage History
| Date | Status | Borrower | Loan Amount |
|---|---|---|---|
| Previous Owner | Johnston Dara D | $228,000 |
Source: Public Records
Tax History
| Year | Tax Paid | Tax Assessment Tax Assessment Total Assessment is a certain percentage of the fair market value that is determined by local assessors to be the total taxable value of land and additions on the property. | Land | Improvement |
|---|---|---|---|---|
| 2025 | $8,458 | $701,300 | $333,200 | $368,100 |
| 2024 | $8,014 | $698,700 | $333,200 | $365,500 |
| 2023 | $7,380 | $658,900 | $309,900 | $349,000 |
| 2022 | $6,403 | $551,500 | $244,700 | $306,800 |
| 2021 | $5,457 | $458,100 | $206,900 | $251,200 |
| 2020 | $6,486 | $432,400 | $206,200 | $226,200 |
| 2019 | $4,321 | $427,900 | $206,200 | $221,700 |
| 2018 | $4,630 | $371,400 | $191,800 | $179,600 |
| 2017 | $3,952 | $327,100 | $157,800 | $169,300 |
| 2016 | $5,135 | $327,100 | $157,800 | $169,300 |
| 2015 | $4,956 | $327,100 | $157,800 | $169,300 |
| 2014 | $4,875 | $332,300 | $174,100 | $158,200 |
| 2013 | -- | $298,500 | $174,100 | $124,400 |
Source: Public Records
Map
Nearby Homes
- 4 Solomon Dr
- 0 Lot #1 Candlewyck Rd
- 0 Lot #2 Candlewyck Rd
- 7 Birdsong Ln
- 4 Hayfield Ln
- 20 Babbidge Rd
- 53 Johnson Rd
- 4 Patriot Dr
- 448 Blackstrap Rd
- 440 Blackstrap Rd
- 21 Cliff Dr
- 11 Fox Run Rd
- 324 Roosevelt Trail
- 9 Daybreak Ln Unit 4
- 7 Daybreak Ln Unit 3
- 7 Magnolia Ln Unit 2
- 1 Friendly Way (On Land of Nod )
- 0 Tinker Ln Unit 57D
- 31 Feldspar Ln Unit 16
- 000 Falmouth Rd
Your Personal Tour Guide
Ask me questions while you tour the home.