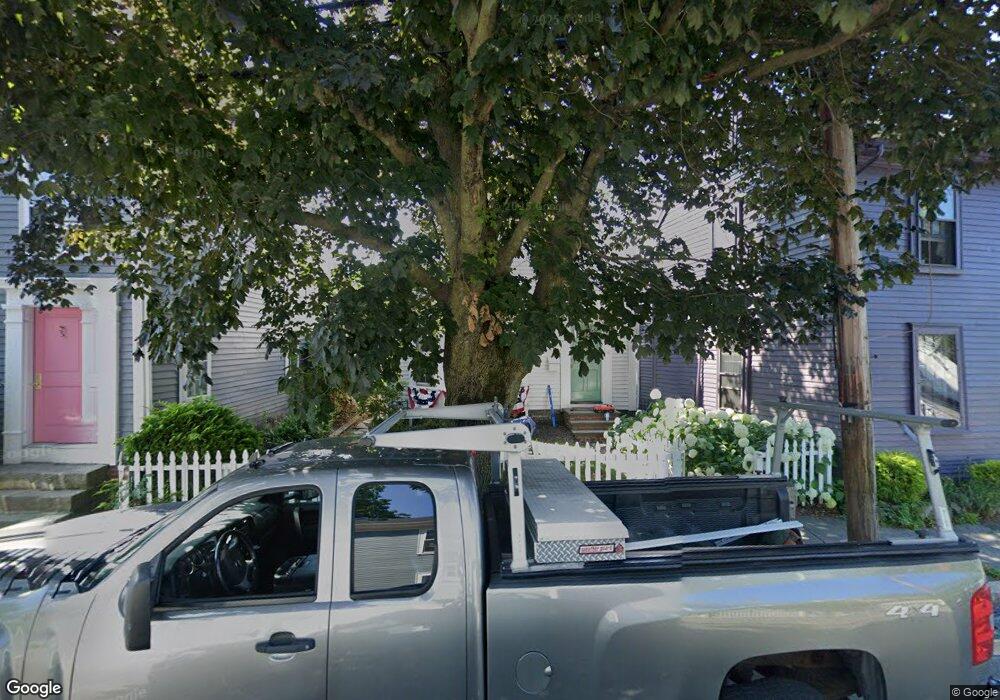
99 Elm St Marblehead, MA 01945
Estimated Value: $779,654 - $1,114,000
2
Beds
2
Baths
1,276
Sq Ft
$750/Sq Ft
Est. Value
About This Home
This home is located at 99 Elm St, Marblehead, MA 01945 and is currently estimated at $957,414, approximately $750 per square foot. 99 Elm St is a home located in Essex County with nearby schools including Marblehead High School, Marblehead Community Charter Public School, and Devereux School.
Ownership History
Date
Name
Owned For
Owner Type
Purchase Details
Closed on
Jul 13, 2011
Sold by
Glaser Sandra D and Tobey Guilford D
Bought by
Olson Bianca W and Olson Matthew C
Current Estimated Value
Home Financials for this Owner
Home Financials are based on the most recent Mortgage that was taken out on this home.
Original Mortgage
$365,493
Interest Rate
4.5%
Mortgage Type
FHA
Purchase Details
Closed on
Feb 14, 2007
Sold by
Zottoli Jeanne M
Bought by
Tobey Guilford D and Glaser Sandra
Purchase Details
Closed on
Feb 15, 1991
Sold by
Minard Frank P
Bought by
Zottoli Jeanne M
Purchase Details
Closed on
Sep 30, 1988
Sold by
Williams Walter
Bought by
Stewart Marion G
Create a Home Valuation Report for This Property
The Home Valuation Report is an in-depth analysis detailing your home's value as well as a comparison with similar homes in the area
Home Values in the Area
Average Home Value in this Area
Purchase History
| Date | Buyer | Sale Price | Title Company |
|---|---|---|---|
| Olson Bianca W | $375,000 | -- | |
| Tobey Guilford D | $427,000 | -- | |
| Zottoli Jeanne M | $190,000 | -- | |
| Stewart Marion G | $248,000 | -- |
Source: Public Records
Mortgage History
| Date | Status | Borrower | Loan Amount |
|---|---|---|---|
| Open | Stewart Marion G | $363,721 | |
| Closed | Stewart Marion G | $365,493 | |
| Previous Owner | Stewart Marion G | $30,000 |
Source: Public Records
Tax History
| Year | Tax Paid | Tax Assessment Tax Assessment Total Assessment is a certain percentage of the fair market value that is determined by local assessors to be the total taxable value of land and additions on the property. | Land | Improvement |
|---|---|---|---|---|
| 2025 | $6,959 | $769,000 | $486,600 | $282,400 |
| 2024 | $6,516 | $727,200 | $465,000 | $262,200 |
| 2023 | $6,510 | $651,000 | $443,400 | $207,600 |
| 2022 | $6,137 | $583,400 | $362,300 | $221,100 |
| 2021 | $5,909 | $567,100 | $346,000 | $221,100 |
| 2020 | $5,472 | $526,700 | $346,000 | $180,700 |
| 2019 | $5,309 | $494,300 | $313,600 | $180,700 |
| 2018 | $5,209 | $472,700 | $292,000 | $180,700 |
| 2017 | $4,847 | $440,200 | $259,500 | $180,700 |
| 2016 | $4,357 | $392,500 | $248,700 | $143,800 |
| 2015 | $4,229 | $381,700 | $237,900 | $143,800 |
| 2014 | $3,745 | $337,700 | $205,500 | $132,200 |
Source: Public Records
Map
Nearby Homes
- 3 Frost Ln Unit 1
- 45 Pleasant St
- 132 Elm St
- 132 Elm St Unit 132
- 7 Mechanic Ct
- 26 Summer St Unit 1
- 66 Pleasant St Unit 1
- 66 Pleasant St Unit 2
- 9 Darling St
- 9 Lincoln Park
- 55 Roosevelt Ave
- 6 Mount Vernon St
- 290 Washington St Unit A
- 55 Brackett Place Unit B
- 41 Atlantic Ave Unit 1
- 7 Cottage St
- 1 Knollwood Rd
- 30 Haley Rd Unit 1
- 23 Wyman Rd
- 21 Kenneth Rd
Your Personal Tour Guide
Ask me questions while you tour the home.