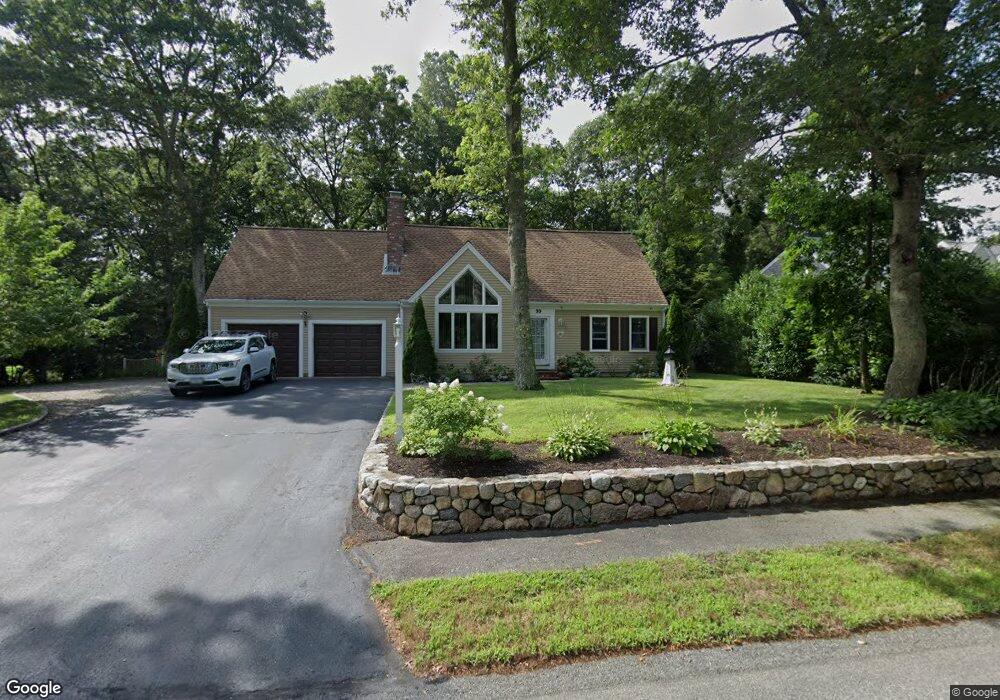
99 Fox Run Ln East Falmouth, MA 02536
Hatchville NeighborhoodEstimated Value: $903,683 - $988,000
4
Beds
3
Baths
1,501
Sq Ft
$628/Sq Ft
Est. Value
About This Home
This home is located at 99 Fox Run Ln, East Falmouth, MA 02536 and is currently estimated at $942,921, approximately $628 per square foot. 99 Fox Run Ln is a home located in Barnstable County with nearby schools including Mullen-Hall School, Morse Pond School, and Lawrence School.
Ownership History
Date
Name
Owned For
Owner Type
Purchase Details
Closed on
Feb 27, 1997
Sold by
Fnma
Bought by
Swenson Ralph K and Swenson Karen A
Current Estimated Value
Purchase Details
Closed on
Nov 5, 1996
Sold by
Sodekson Stephen H and Sodekson Kathleen M
Bought by
Federal National Mortgage Association
Purchase Details
Closed on
Oct 21, 1994
Sold by
Irene T T and Irene Priestly
Bought by
Sodekson Stephen H and Sodekson Kathleen M
Create a Home Valuation Report for This Property
The Home Valuation Report is an in-depth analysis detailing your home's value as well as a comparison with similar homes in the area
Home Values in the Area
Average Home Value in this Area
Purchase History
| Date | Buyer | Sale Price | Title Company |
|---|---|---|---|
| Swenson Ralph K | $151,000 | -- | |
| Swenson Ralph K | $151,000 | -- | |
| Federal National Mortgage Association | $158,000 | -- | |
| Federal National Mortgage Association | $158,000 | -- | |
| Sodekson Stephen H | $171,400 | -- | |
| Sodekson Stephen H | $171,400 | -- |
Source: Public Records
Mortgage History
| Date | Status | Borrower | Loan Amount |
|---|---|---|---|
| Open | Sodekson Stephen H | $192,000 | |
| Closed | Sodekson Stephen H | $155,000 |
Source: Public Records
Tax History Compared to Growth
Tax History
| Year | Tax Paid | Tax Assessment Tax Assessment Total Assessment is a certain percentage of the fair market value that is determined by local assessors to be the total taxable value of land and additions on the property. | Land | Improvement |
|---|---|---|---|---|
| 2025 | $4,918 | $837,800 | $255,600 | $582,200 |
| 2024 | $4,732 | $753,500 | $223,700 | $529,800 |
| 2023 | $4,326 | $625,200 | $167,700 | $457,500 |
| 2022 | $4,115 | $511,200 | $140,700 | $370,500 |
| 2021 | $3,655 | $430,000 | $129,000 | $301,000 |
| 2020 | $3,593 | $418,300 | $117,300 | $301,000 |
| 2019 | $3,517 | $410,900 | $117,300 | $293,600 |
| 2018 | $3,439 | $399,900 | $117,300 | $282,600 |
| 2017 | $3,310 | $388,100 | $117,300 | $270,800 |
| 2016 | $3,245 | $387,700 | $117,300 | $270,400 |
| 2015 | $3,175 | $387,700 | $117,300 | $270,400 |
| 2014 | $3,155 | $387,100 | $123,500 | $263,600 |
Source: Public Records
Map
Nearby Homes
- 46 Alderberry Ln
- 809 Sandwich Rd
- 24 Little John Rd
- 23 Little John Rd
- 746 Carriage Shop Rd
- 746 Carriage Shop Rd
- 136 Ashumet Rd
- 11 Ranch Rd
- 571 Carriage Shop Rd Unit E
- 3 Viber Ln
- 533 Old Barnstable Rd
- 11 Shallow Pond Ln
- 47 Shallow Pond Ln
- 590 Sandwich Rd
- 184 Monhegan Rd
- 28 Plum Hollow Rd
- 409 Currier Rd
- 30 Twin Hill Rd
- 85 Kompass Dr