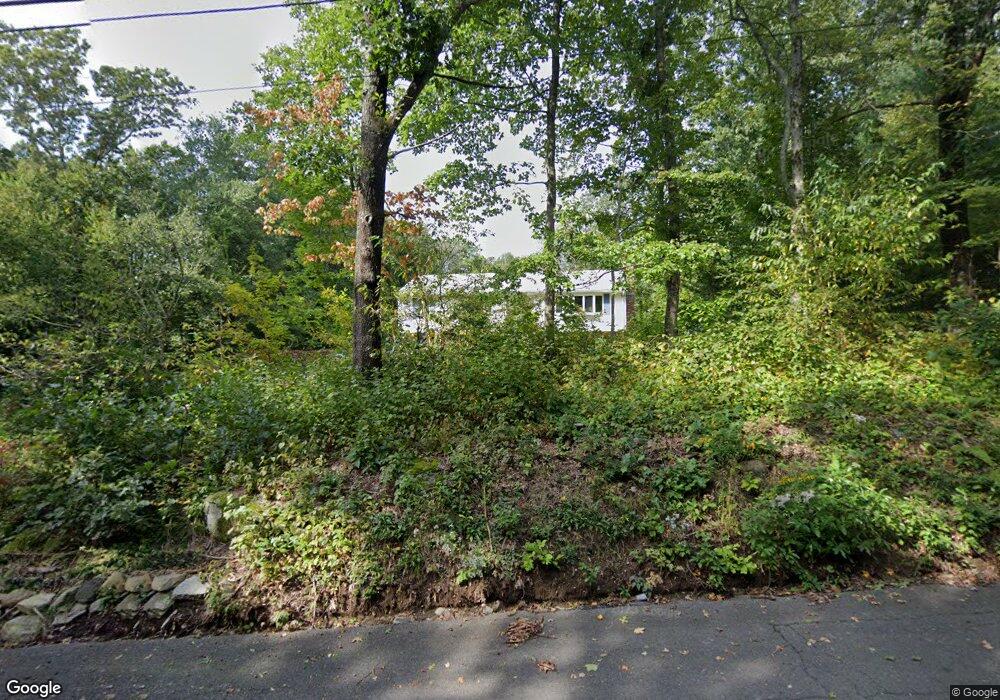
99 Handel Rd Stafford Springs, CT 06076
Stafford NeighborhoodEstimated Value: $312,000 - $417,000
3
Beds
2
Baths
1,384
Sq Ft
$257/Sq Ft
Est. Value
About This Home
This home is located at 99 Handel Rd, Stafford Springs, CT 06076 and is currently estimated at $356,135, approximately $257 per square foot. 99 Handel Rd is a home located in Tolland County with nearby schools including Stafford Elementary School, Stafford Middle School, and Stafford High School.
Ownership History
Date
Name
Owned For
Owner Type
Purchase Details
Closed on
Dec 27, 2012
Sold by
Burns Rose M
Bought by
Burns Christopher A
Current Estimated Value
Purchase Details
Closed on
Aug 18, 1993
Sold by
Gauthier David and Gauthier Judith
Bought by
Burns Christopher and Padeco Rose Mary
Home Financials for this Owner
Home Financials are based on the most recent Mortgage that was taken out on this home.
Original Mortgage
$104,000
Interest Rate
7%
Mortgage Type
Unknown
Create a Home Valuation Report for This Property
The Home Valuation Report is an in-depth analysis detailing your home's value as well as a comparison with similar homes in the area
Home Values in the Area
Average Home Value in this Area
Purchase History
| Date | Buyer | Sale Price | Title Company |
|---|---|---|---|
| Burns Christopher A | -- | -- | |
| Burns Christopher | $32,000 | -- |
Source: Public Records
Mortgage History
| Date | Status | Borrower | Loan Amount |
|---|---|---|---|
| Closed | Burns Christopher | $50,000 | |
| Previous Owner | Burns Christopher | $93,000 | |
| Previous Owner | Burns Christopher | $92,300 | |
| Previous Owner | Burns Christopher | $104,000 |
Source: Public Records
Tax History Compared to Growth
Tax History
| Year | Tax Paid | Tax Assessment Tax Assessment Total Assessment is a certain percentage of the fair market value that is determined by local assessors to be the total taxable value of land and additions on the property. | Land | Improvement |
|---|---|---|---|---|
| 2025 | $9,376 | $160,020 | $33,810 | $126,210 |
| 2024 | $6,175 | $160,020 | $33,810 | $126,210 |
| 2023 | $5,882 | $160,020 | $33,810 | $126,210 |
| 2022 | $5,726 | $160,020 | $33,810 | $126,210 |
| 2021 | $5,589 | $160,020 | $33,810 | $126,210 |
| 2020 | $5,223 | $149,520 | $39,340 | $110,180 |
| 2019 | $5,223 | $149,520 | $39,340 | $110,180 |
| 2018 | $5,123 | $149,520 | $39,340 | $110,180 |
| 2017 | $5,073 | $149,520 | $39,340 | $110,180 |
| 2016 | $5,010 | $149,520 | $39,340 | $110,180 |
| 2015 | $5,018 | $150,360 | $39,340 | $111,020 |
| 2014 | $4,966 | $150,360 | $39,340 | $111,020 |
Source: Public Records
Map
Nearby Homes