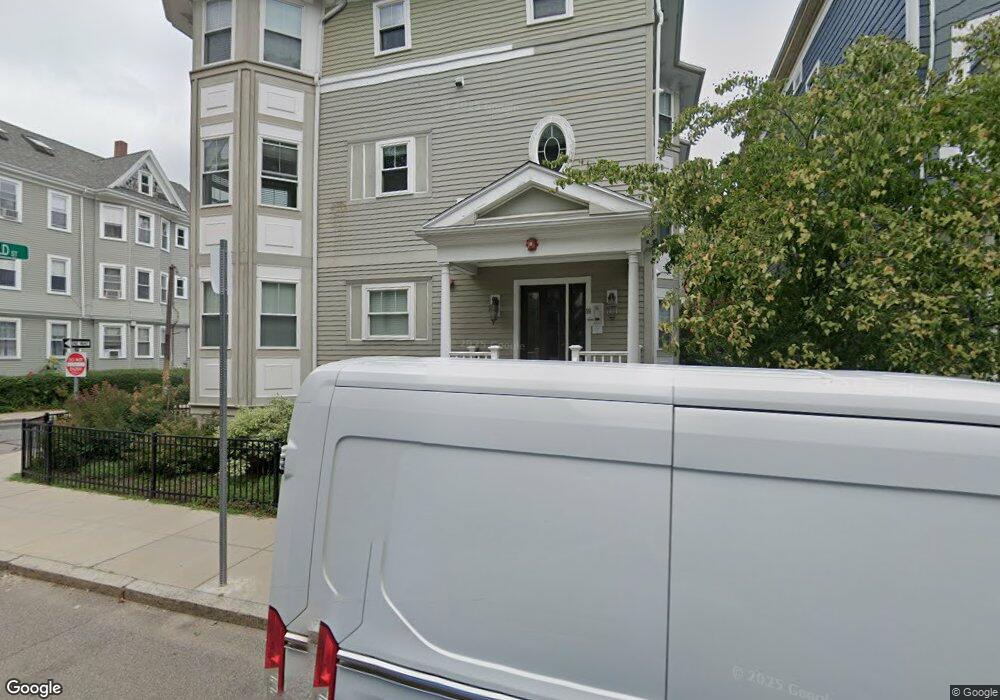
99 Hillside St Roxbury Crossing, MA 02120
Mission Hill NeighborhoodEstimated Value: $2,481,000 - $2,872,000
9
Beds
6
Baths
4,260
Sq Ft
$615/Sq Ft
Est. Value
About This Home
This home is located at 99 Hillside St, Roxbury Crossing, MA 02120 and is currently estimated at $2,621,333, approximately $615 per square foot. 99 Hillside St is a home located in Suffolk County with nearby schools including Roxbury Preparatory Charter School, Malik Academy, and Manville School.
Ownership History
Date
Name
Owned For
Owner Type
Purchase Details
Closed on
Oct 7, 2011
Sold by
Quartier Philip F and Quartier Barbara P
Bought by
P and Quartier T
Current Estimated Value
Purchase Details
Closed on
Sep 12, 2011
Sold by
P and Quartier T
Bought by
Quartier Philip F and Quartier Barbara P
Purchase Details
Closed on
May 3, 2011
Sold by
Quartier Phillip F and Quartier Barbara P
Bought by
P and Quartier T
Purchase Details
Closed on
Dec 6, 2004
Sold by
Morgan James
Bought by
Quartier Philip F and Quartier Barbara P
Create a Home Valuation Report for This Property
The Home Valuation Report is an in-depth analysis detailing your home's value as well as a comparison with similar homes in the area
Home Values in the Area
Average Home Value in this Area
Purchase History
| Date | Buyer | Sale Price | Title Company |
|---|---|---|---|
| P | -- | -- | |
| Quartier Philip F | -- | -- | |
| P | -- | -- | |
| Quartier Philip F | $112,000 | -- | |
| Morgan James | -- | -- |
Source: Public Records
Tax History Compared to Growth
Tax History
| Year | Tax Paid | Tax Assessment Tax Assessment Total Assessment is a certain percentage of the fair market value that is determined by local assessors to be the total taxable value of land and additions on the property. | Land | Improvement |
|---|---|---|---|---|
| 2025 | $25,836 | $2,231,100 | $638,300 | $1,592,800 |
| 2024 | $24,516 | $2,249,200 | $604,400 | $1,644,800 |
| 2023 | $24,156 | $2,249,200 | $604,400 | $1,644,800 |
| 2022 | $23,754 | $2,183,300 | $586,700 | $1,596,600 |
| 2021 | $21,978 | $2,059,800 | $553,500 | $1,506,300 |
| 2020 | $20,675 | $1,957,900 | $495,300 | $1,462,600 |
| 2019 | $18,757 | $1,779,600 | $341,800 | $1,437,800 |
| 2018 | $17,263 | $1,647,200 | $341,800 | $1,305,400 |
| 2017 | $16,456 | $1,553,900 | $341,800 | $1,212,100 |
| 2016 | $14,863 | $1,351,200 | $341,800 | $1,009,400 |
| 2015 | $13,443 | $1,110,100 | $288,100 | $822,000 |
| 2014 | $11,889 | $945,100 | $288,100 | $657,000 |
Source: Public Records
Map
Nearby Homes
- 7 Oswald St
- 24 Sachem St
- 155-157 Hillside St
- 18 Eldora St
- 196 Hillside St Unit 2
- 196 Hillside St Unit 1
- 196 Hillside St Unit 3
- 820-824 Huntington Ave
- 134-140 Smith St
- 92 Lawn St Unit 7-160
- 251 Heath St Unit 501
- 22 Fisher Ave
- 743 Parker St Unit 3
- 6 Fisher Ave
- 70 Jamaicaway Unit 16
- 50 Jamaicaway Unit 1
- 386 Riverway Unit 4
- 390 Riverway Unit 6
- 390 Riverway Unit 24
- 124-126 Minden St Unit 126-2
- 99 Hillside St Unit 1
- 99 Hillside St
- 99 Hillside St Unit 3
- 99 Hillside St Unit 2
- 97 Hillside St
- 97 Hillside St Unit 4
- 97 Hillside St
- 97 Hillside St Unit A
- 97 Hillside St Unit 3
- 97 Hillside St Unit 2
- 97 Hillside St Unit 1
- 12 Oswald St Unit 3
- 12 Oswald St Unit 2
- 12 Oswald St Unit 1
- 12 Oswald St Unit 4
- 12 Oswald St
- 12 Oswald St Unit 2A
- 12 Oswald St Unit 2B
- 0 Hillside St Unit 2 70194780
- 0 Hillside St Unit 1 70217633